Technical Analysis of DSTX 2024-05-10
Overview:
In analyzing the technical indicators for DSTX over the last 5 days, we will delve into the trend, momentum, volatility, and volume indicators to provide a comprehensive outlook on the possible stock price movement in the coming days. By examining these key aspects, we aim to offer valuable insights and predictions for potential investors.
Trend Analysis:
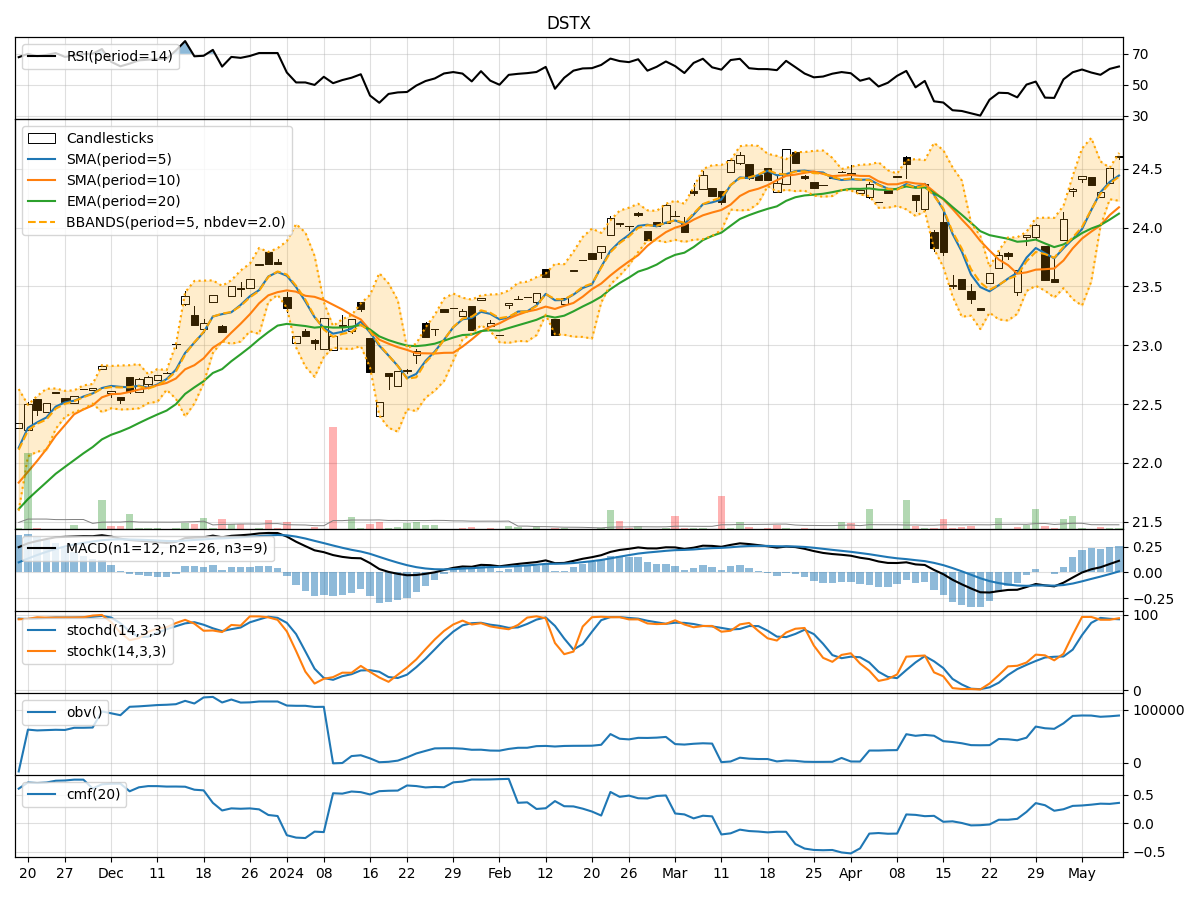
- Moving Averages (MA): The 5-day Moving Average (MA) has been steadily increasing, indicating a positive trend in the stock price.
- MACD: The Moving Average Convergence Divergence (MACD) has been consistently rising, suggesting bullish momentum in the stock.
- EMA: The Exponential Moving Average (EMA) has also been on an upward trajectory, supporting the bullish trend.
Momentum Analysis:
- RSI: The Relative Strength Index (RSI) has been fluctuating around the 60 level, indicating moderate momentum in the stock.
- Stochastic Oscillator: Both %K and %D values have been in the overbought territory, signaling a potential reversal or consolidation.
- Williams %R: The Williams %R is hovering around the oversold region, suggesting a possible buying opportunity.
Volatility Analysis:
- Bollinger Bands: The Bollinger Bands have been relatively narrow, indicating low volatility in the stock price.
- Bollinger %B: The %B value has been fluctuating around the midline, suggesting a balanced market sentiment.
Volume Analysis:
- On-Balance Volume (OBV): The OBV has shown a slight increase, indicating a positive accumulation of the stock.
- Chaikin Money Flow (CMF): The CMF has been trending upwards, reflecting buying pressure in the stock.
Key Observations:
- The trend indicators suggest a bullish sentiment with rising moving averages and MACD.
- Momentum indicators show mixed signals with RSI in a neutral zone and stochastic oscillators at extreme levels.
- Volatility remains low based on Bollinger Bands, indicating a stable price movement.
- Volume indicators point towards positive accumulation and buying pressure in the stock.
Conclusion:
Based on the analysis of the technical indicators, the next few days' possible stock price movement for DSTX is likely to be upward. The bullish trend supported by moving averages and MACD, coupled with positive volume indicators, suggests a potential price appreciation. However, caution is advised due to mixed signals from momentum indicators, indicating a possible consolidation or minor pullback before resuming the upward trend. Investors should closely monitor the stochastic oscillators for potential reversal signals and consider the overall market conditions for a well-rounded investment decision.