Technical Analysis of DTD 2024-05-10
Overview:
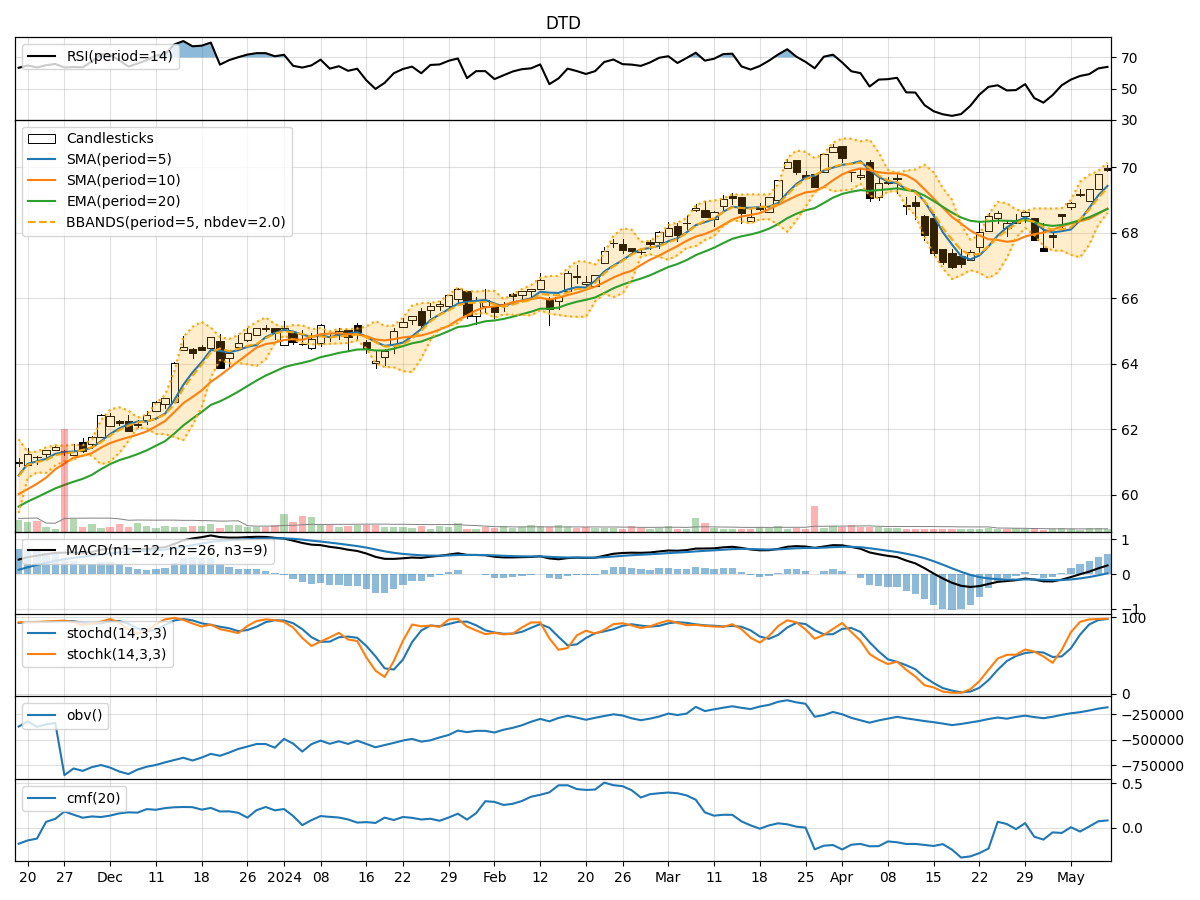
In analyzing the technical indicators for the stock over the last 5 days, we will delve into the trend, momentum, volatility, and volume indicators to provide a comprehensive outlook on the possible stock price movement in the coming days. By examining these key indicators, we aim to offer valuable insights and predictions for informed decision-making.
Trend Analysis:
- Moving Averages (MA): The stock's closing prices have been consistently above the 5-day moving average, indicating a short-term uptrend.
- MACD: The MACD line has been consistently above the signal line, suggesting bullish momentum.
- EMA: The exponential moving average has been trending upwards, supporting the bullish sentiment.
Momentum Analysis:
- RSI: The Relative Strength Index has been increasing, indicating strengthening momentum.
- Stochastic Oscillator: Both %K and %D have been in overbought territory, suggesting a potential reversal.
- Williams %R: The stock has been oversold, signaling a possible buying opportunity.
Volatility Analysis:
- Bollinger Bands: The stock price has been trading within the bands, indicating moderate volatility.
- Bollinger %B: The %B indicator has been fluctuating around 0.8, suggesting a balanced volatility level.
Volume Analysis:
- On-Balance Volume (OBV): The OBV has been steadily increasing, reflecting positive buying pressure.
- Chaikin Money Flow (CMF): The CMF has been positive, indicating strong accumulation.
Key Observations:
- The stock is currently in an upward trend supported by moving averages and MACD.
- Momentum indicators suggest a potential reversal due to overbought conditions.
- Volatility remains moderate, with the stock trading within Bollinger Bands.
- Volume indicators show positive buying pressure and accumulation.
Conclusion:
Based on the analysis of the technical indicators, the stock is likely to experience a short-term pullback or consolidation in the coming days due to overbought conditions indicated by momentum indicators. However, the overall trend remains bullish, supported by moving averages and positive volume indicators. Traders may consider taking profits or waiting for a better entry point during the anticipated pullback. It is essential to monitor the price action closely for potential buying opportunities once the stock corrects from overbought levels.