Technical Analysis of DTEC 2024-05-10
Overview:
In analyzing the technical indicators for DTEC over the last 5 days, we will delve into the trend, momentum, volatility, and volume indicators to provide a comprehensive outlook on the possible stock price movement in the coming days. By examining these key aspects, we aim to offer valuable insights and predictions to guide your investment decisions.
Trend Analysis:
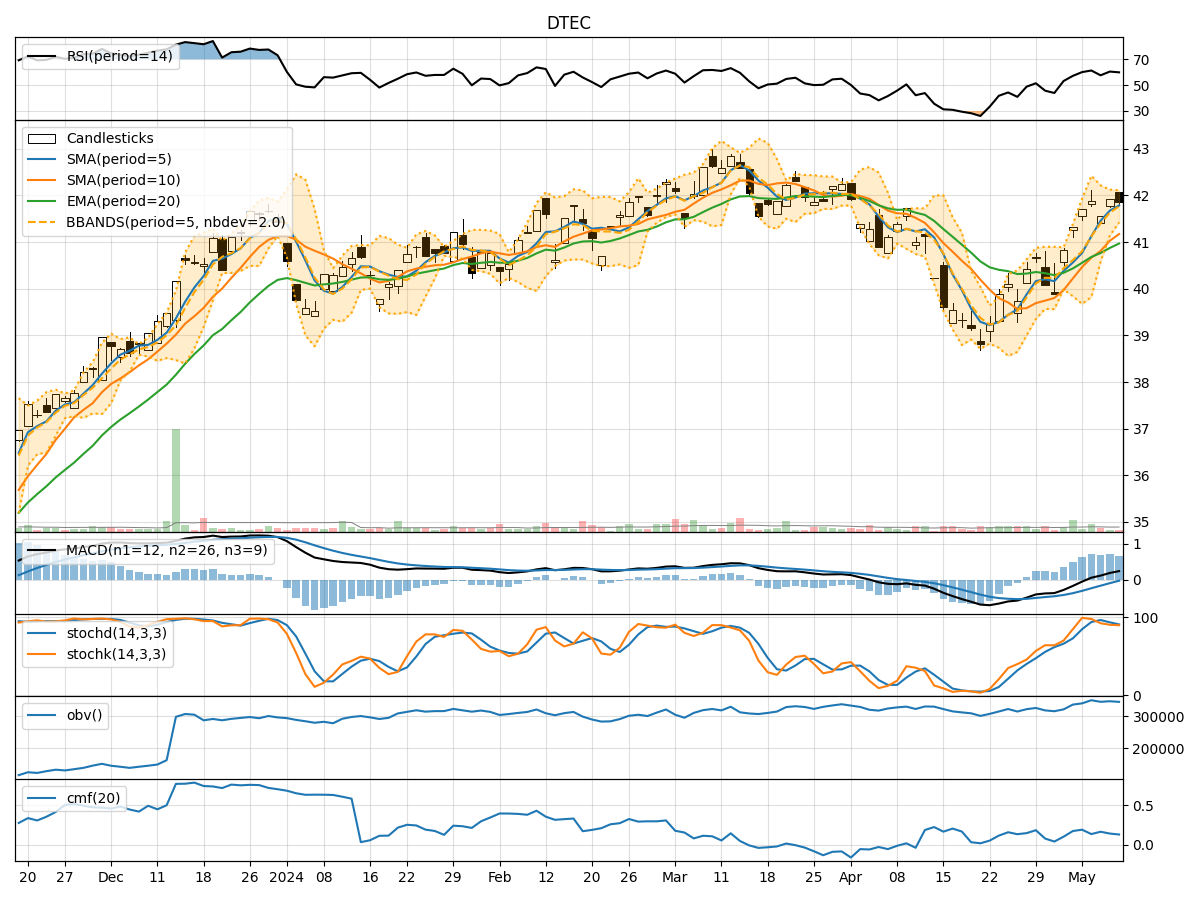
- Moving Averages (MA): The 5-day Moving Average (MA) has been consistently above the Simple Moving Average (SMA) and Exponential Moving Average (EMA) over the past 5 days, indicating a bullish trend.
- MACD: The MACD line has been consistently above the signal line, with both lines showing an upward trend, suggesting bullish momentum.
- Conclusion: The trend indicators point towards an upward movement in the stock price.
Momentum Analysis:
- RSI: The Relative Strength Index (RSI) has been fluctuating around the 60 level, indicating moderate momentum in the stock.
- Stochastic Oscillator: Both %K and %D levels of the Stochastic Oscillator have been hovering around the overbought territory, suggesting a potential reversal.
- Conclusion: The momentum indicators suggest a neutral to slightly bearish outlook for the stock.
Volatility Analysis:
- Bollinger Bands (BB): The stock price has mostly remained within the Bollinger Bands, with the bands narrowing in recent days, indicating decreasing volatility.
- Conclusion: Volatility indicators signal a low volatility environment for the stock.
Volume Analysis:
- On-Balance Volume (OBV): The OBV has shown mixed movements over the past 5 days, reflecting indecision among market participants.
- Chaikin Money Flow (CMF): The CMF has been positive but trending downwards, suggesting weakening buying pressure.
- Conclusion: Volume indicators imply a lack of strong conviction in the stock.
Overall Conclusion:
Based on the analysis of trend, momentum, volatility, and volume indicators, the next few days' possible stock price movement for DTEC is likely to be sideways with a slight bearish bias. While the trend indicators point towards an upward movement, the momentum indicators suggest a neutral to bearish outlook. Additionally, low volatility and mixed volume signals indicate a lack of strong conviction in either direction.
Recommendation:
Considering the mixed signals from the technical indicators, it is advisable to exercise caution and closely monitor the stock's price action in the coming days. Traders may consider implementing risk management strategies to navigate the potential sideways movement with a bearish bias. It is essential to wait for clearer signals or confirmation from the indicators before making significant trading decisions.
By staying informed and adaptable to changing market conditions, investors can position themselves strategically to capitalize on potential opportunities while managing risks effectively.