Technical Analysis of DUBS 2024-05-10
Overview:
In analyzing the technical indicators for DUBS stock over the last 5 days, we will delve into the trends, momentum, volatility, and volume indicators to provide a comprehensive outlook on the possible future stock price movement. By examining these key indicators, we aim to offer valuable insights and recommendations for potential investors.
Trend Analysis:
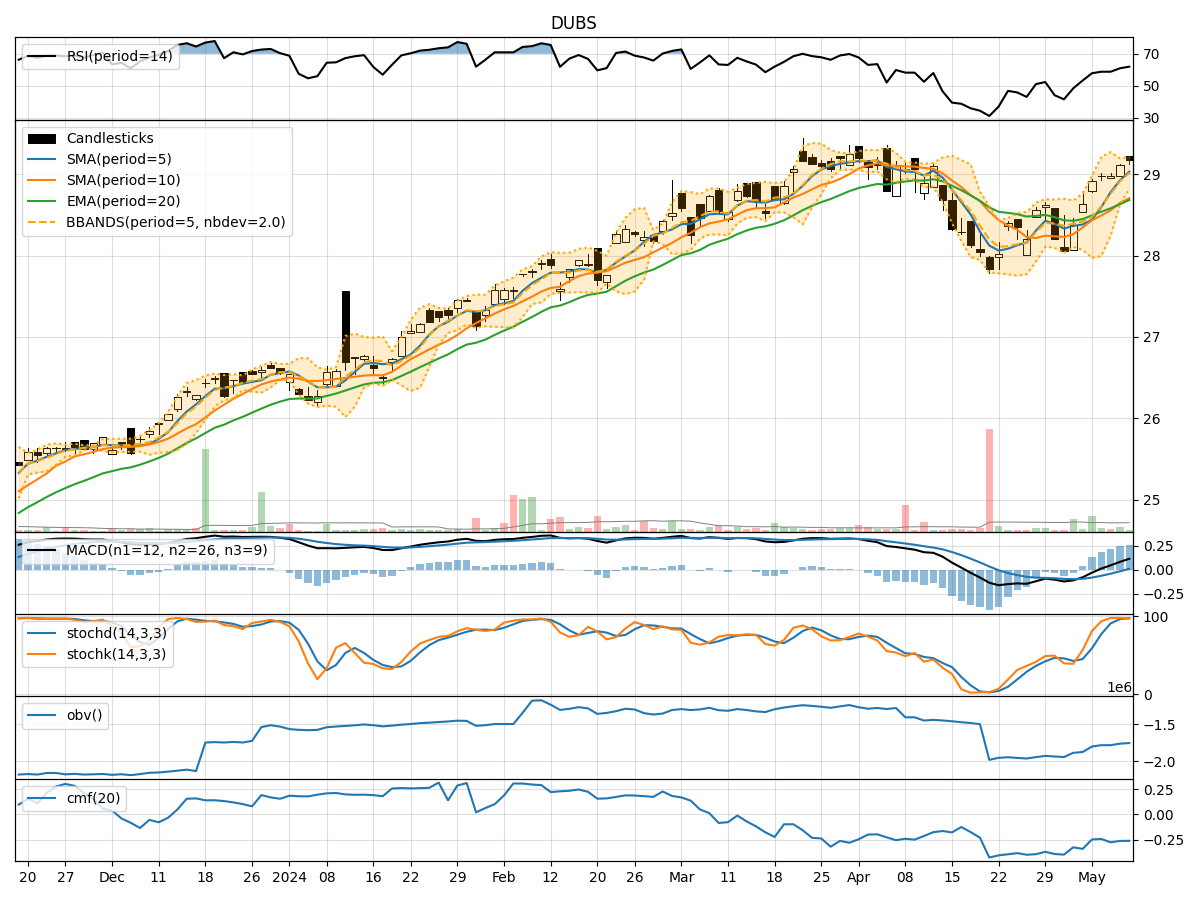
- Moving Averages (MA): The 5-day Moving Average (MA) has been consistently above the Simple Moving Average (SMA) and Exponential Moving Average (EMA), indicating a bullish trend.
- MACD: The MACD line has been consistently above the signal line, with both lines showing an upward trend, suggesting bullish momentum.
- MACD Histogram: The MACD Histogram has been increasing over the last 5 days, indicating strengthening bullish momentum.
Momentum Analysis:
- RSI: The Relative Strength Index (RSI) has been gradually increasing and is currently in the overbought territory, suggesting a strong bullish momentum.
- Stochastic Oscillator: Both %K and %D lines of the Stochastic Oscillator are in the overbought zone, indicating a strong bullish momentum.
- Williams %R: The Williams %R is in the oversold territory, suggesting a potential reversal in the bullish momentum.
Volatility Analysis:
- Bollinger Bands: The stock price has been consistently trading above the middle Bollinger Band (bbm), indicating an upward trend with low volatility.
- Bollinger %B: The Bollinger %B is above 0.5, suggesting that the stock price is trading closer to the upper Bollinger Band (bbu), indicating bullish momentum.
Volume Analysis:
- On-Balance Volume (OBV): The OBV has been gradually decreasing over the last 5 days, indicating a divergence between price and volume, which could signal a potential reversal.
- Chaikin Money Flow (CMF): The CMF has been negative, indicating selling pressure in the stock.
Conclusion:
Based on the analysis of the technical indicators, the next few days' possible stock price movement for DUBS appears to be upward. The bullish trends in moving averages, MACD, RSI, and Stochastic Oscillator suggest a continuation of the current upward momentum. However, the overbought conditions in RSI and Stochastic %K/%D, along with the negative CMF, indicate a potential need for caution as the stock may experience a short-term pullback before resuming its upward trajectory. Investors should closely monitor the price action and volume dynamics for confirmation of the bullish trend.