Technical Analysis of DUHP 2024-05-10
Overview:
In analyzing the technical indicators for DUHP stock over the last 5 days, we will delve into the trend, momentum, volatility, and volume indicators to provide a comprehensive outlook on the possible stock price movement in the coming days. By examining these key indicators, we aim to offer valuable insights and predictions for potential investors.
Trend Analysis:
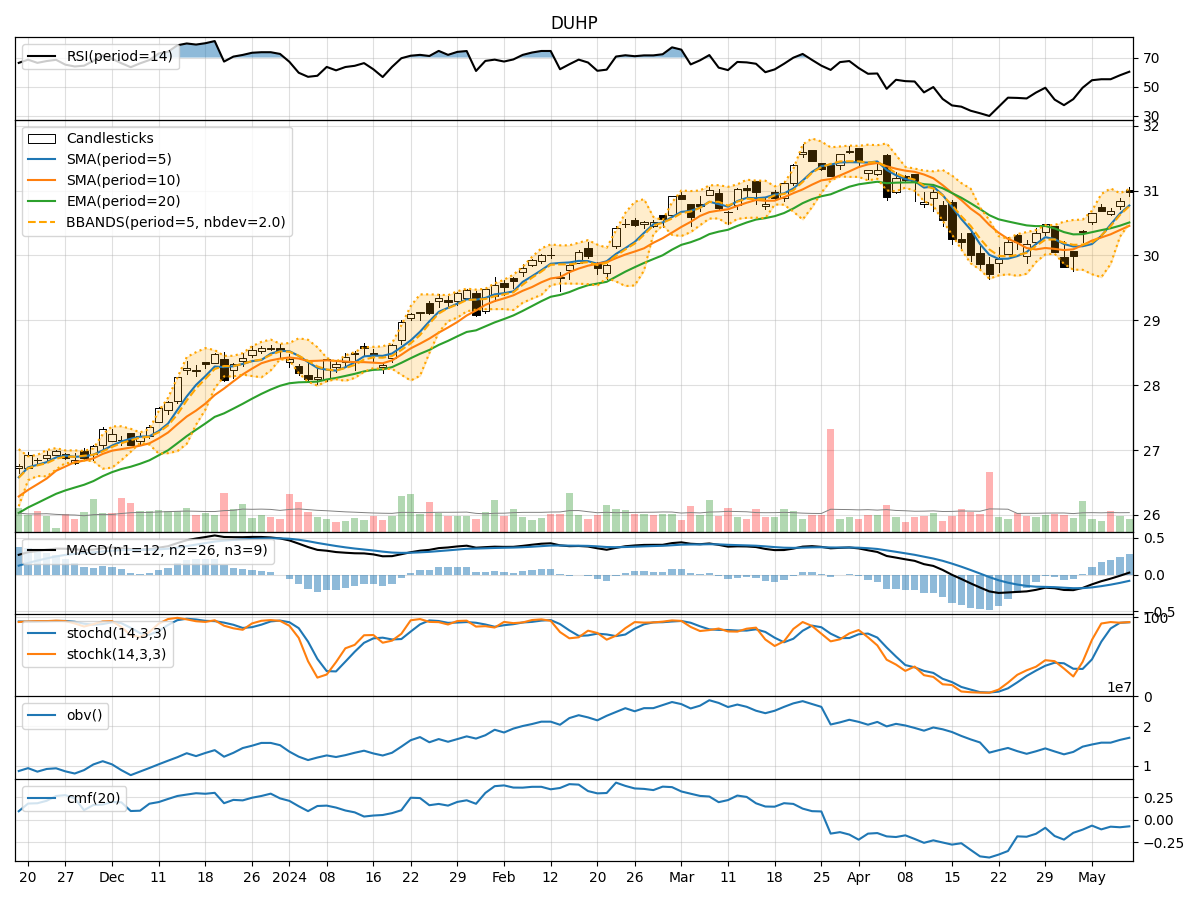
- Moving Averages (MA): The 5-day MA has been consistently above the closing prices, indicating a short-term uptrend.
- MACD: The MACD line has been positive, suggesting bullish momentum in the stock.
- Relative Strength Index (RSI): The RSI has been fluctuating around the neutral zone, indicating a balanced buying and selling pressure.
Key Observation: The trend indicators suggest a bullish sentiment in the short term.
Momentum Analysis:
- Stochastic Oscillator: Both %K and %D have been in the overbought zone, signaling a potential reversal.
- Williams %R (WillR): The Williams %R has been hovering in the oversold territory, indicating a possible buying opportunity.
Key Observation: Momentum indicators show conflicting signals, with stochastic indicating a potential reversal and Williams %R suggesting a buying opportunity.
Volatility Analysis:
- Bollinger Bands (BB): The stock price has been trading within the bands, indicating normal volatility.
- Bollinger %B (BBP): The %B has been fluctuating around 1, suggesting the stock is trading close to the upper band.
Key Observation: Volatility indicators imply a stable price movement within the bands.
Volume Analysis:
- On-Balance Volume (OBV): The OBV has been declining, indicating a potential distribution phase.
- Chaikin Money Flow (CMF): The CMF has been negative, suggesting selling pressure in the stock.
Key Observation: Volume indicators point towards a bearish sentiment due to declining OBV and negative CMF.
Conclusion:
Based on the analysis of trend, momentum, volatility, and volume indicators, the stock is likely to experience a short-term consolidation or a minor pullback. The conflicting signals from momentum indicators suggest a possible reversal, while the volume indicators indicate a bearish sentiment. Therefore, investors should exercise caution and consider waiting for more clarity in the market before making any significant trading decisions.
Recommendation:
- Short-term Traders: Consider taking profits or tightening stop-loss levels to manage risk.
- Long-term Investors: Monitor the price action closely and wait for a clearer trend confirmation before making any new investment decisions.
In conclusion, the stock is currently in a consolidation phase with a slight bearish bias. It is essential for investors to closely monitor the price action and key technical levels to make informed trading decisions.