Technical Analysis of DURA 2024-05-10
Overview:
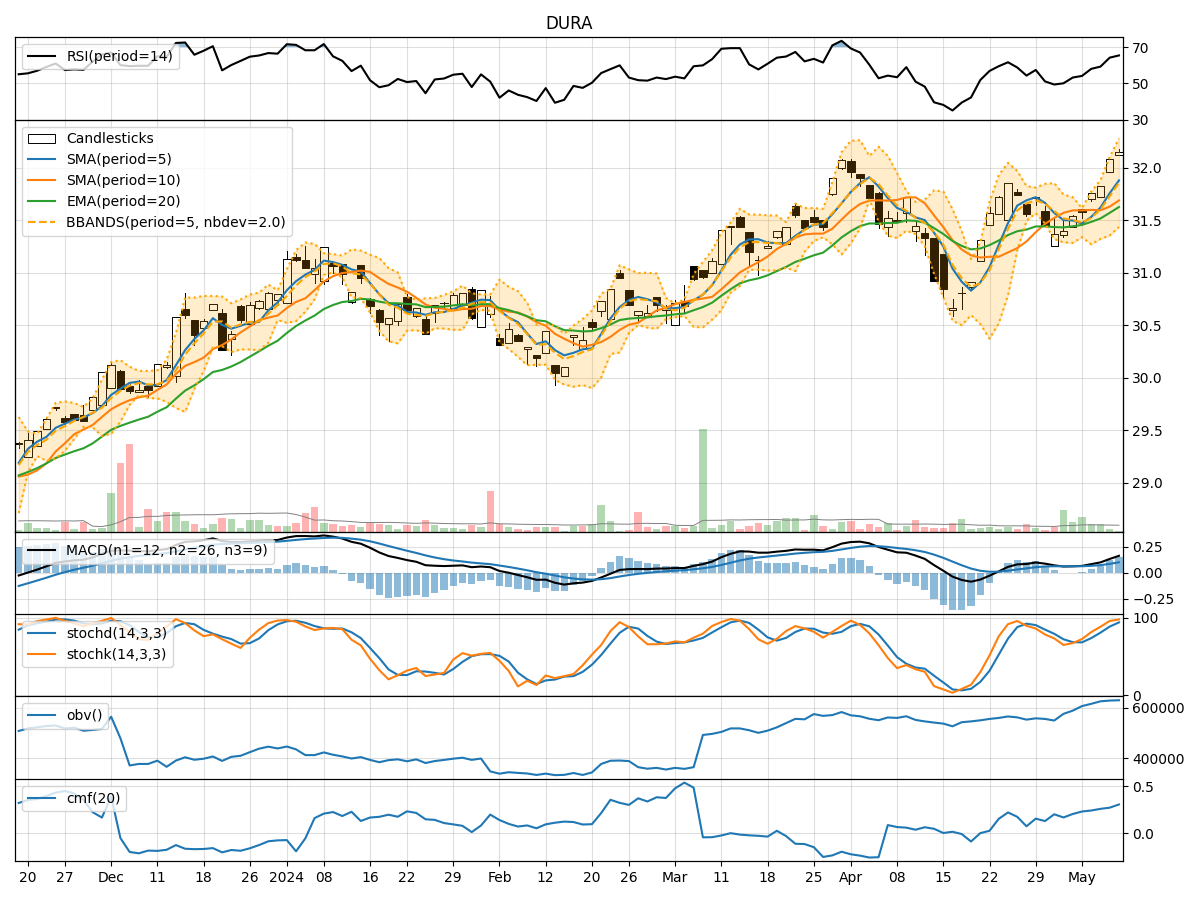
In the last 5 trading days, DURA stock has shown a consistent uptrend in its price, supported by increasing volume and positive momentum indicators. The stock has also exhibited low volatility, indicating a stable price movement. However, it is essential to delve deeper into the technical indicators to provide a comprehensive analysis and forecast for the next few days.
Trend Analysis:
- Moving Averages (MA): The 5-day Moving Average (MA) has been trending above the Simple Moving Average (SMA) and Exponential Moving Average (EMA), indicating a short-term bullish trend.
- MACD: The MACD line has been consistently above the signal line, with both lines showing an upward trajectory, suggesting a continuation of the bullish momentum.
Key Observation: The trend indicators suggest a strong bullish sentiment in the stock price.
Momentum Analysis:
- RSI: The Relative Strength Index (RSI) has been consistently above 50, indicating bullish momentum in the stock.
- Stochastic Oscillator: Both %K and %D lines of the Stochastic Oscillator are in the overbought zone, suggesting a potential reversal or consolidation.
Key Observation: The momentum indicators signal a strong bullish sentiment, but the overbought condition may lead to a short-term correction or consolidation.
Volatility Analysis:
- Bollinger Bands (BB): The Bollinger Bands have been widening, indicating increased volatility in the stock price.
Key Observation: The volatility indicators suggest a potential increase in price fluctuations in the upcoming days.
Volume Analysis:
- On-Balance Volume (OBV): The OBV has been steadily increasing, reflecting strong buying pressure in the stock.
- Chaikin Money Flow (CMF): The CMF is positive, indicating that money is flowing into the stock.
Key Observation: The volume indicators support the bullish trend, showing accumulation of the stock by investors.
Conclusion:
Based on the analysis of the technical indicators, the next few days' possible stock price movement for DURA is likely to continue in an upward direction. The trend indicators, momentum indicators, and volume indicators all point towards a bullish sentiment in the stock. However, the overbought condition in the Stochastic Oscillator suggests a potential short-term correction or consolidation. Traders should closely monitor the price action and consider taking profits or adjusting their positions accordingly.
Overall View: Bullish with a possibility of short-term correction or consolidation due to overbought conditions.