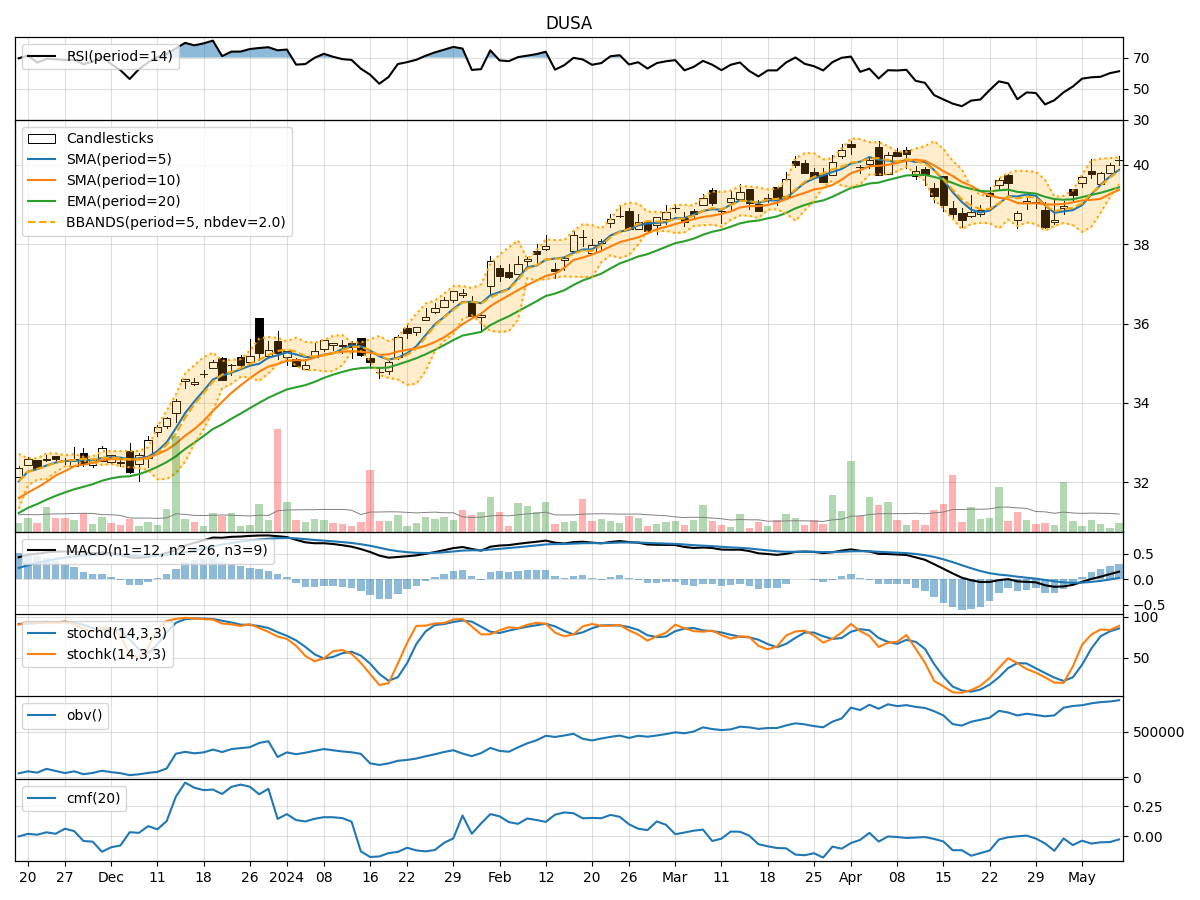
Technical Analysis of DUSA 2024-05-10
Overview:
In analyzing the technical indicators for DUSA over the last 5 days, we will delve into the trend, momentum, volatility, and volume indicators to provide a comprehensive assessment of the stock's potential price movement. By examining these key factors, we aim to offer valuable insights and predictions for the next few days.
Trend Indicators:
- Moving Averages (MA): The 5-day MA has been consistently trending upwards, indicating a bullish momentum in the short term.
- MACD: The MACD line has been above the signal line for the past few days, suggesting a positive trend in momentum.
- MACD Histogram: The histogram has been increasing, indicating strengthening bullish momentum.
Momentum Indicators:
- RSI: The RSI has been gradually increasing and is currently in the overbought territory, signaling a strong bullish momentum.
- Stochastic Oscillator: Both %K and %D lines are in the overbought zone, indicating a potential reversal or consolidation.
- Williams %R: The indicator is in the oversold region, suggesting a potential reversal to the upside.
Volatility Indicators:
- Bollinger Bands: The bands have been narrowing, indicating decreasing volatility and a possible period of consolidation.
- Bollinger %B: The %B is approaching 1, suggesting the stock is trading near the upper band and may be overbought.
Volume Indicators:
- On-Balance Volume (OBV): The OBV has been steadily increasing, indicating accumulation by investors.
- Chaikin Money Flow (CMF): The CMF has been negative, suggesting selling pressure in the stock.
Key Observations:
- The trend indicators show a strong bullish sentiment in the short term.
- Momentum indicators indicate a potential overbought condition, signaling a need for caution.
- Volatility indicators suggest a period of consolidation or a potential reversal.
- Volume indicators show mixed signals with OBV indicating accumulation but CMF showing selling pressure.
Conclusion:
Based on the analysis of the technical indicators, the next few days' possible stock price movement for DUSA is likely to be sideways or consolidating with a potential for a slight pullback due to the overbought conditions indicated by the momentum indicators. Traders should exercise caution and consider taking profits or implementing risk management strategies in anticipation of a possible correction.