Technical Analysis of DUSL 2024-05-10
Overview:
In analyzing the technical indicators for DUSL over the last 5 days, we will delve into the trend, momentum, volatility, and volume indicators to provide a comprehensive outlook on the possible stock price movement in the coming days. By examining these key aspects, we aim to offer valuable insights and predictions for potential investors.
Trend Analysis:
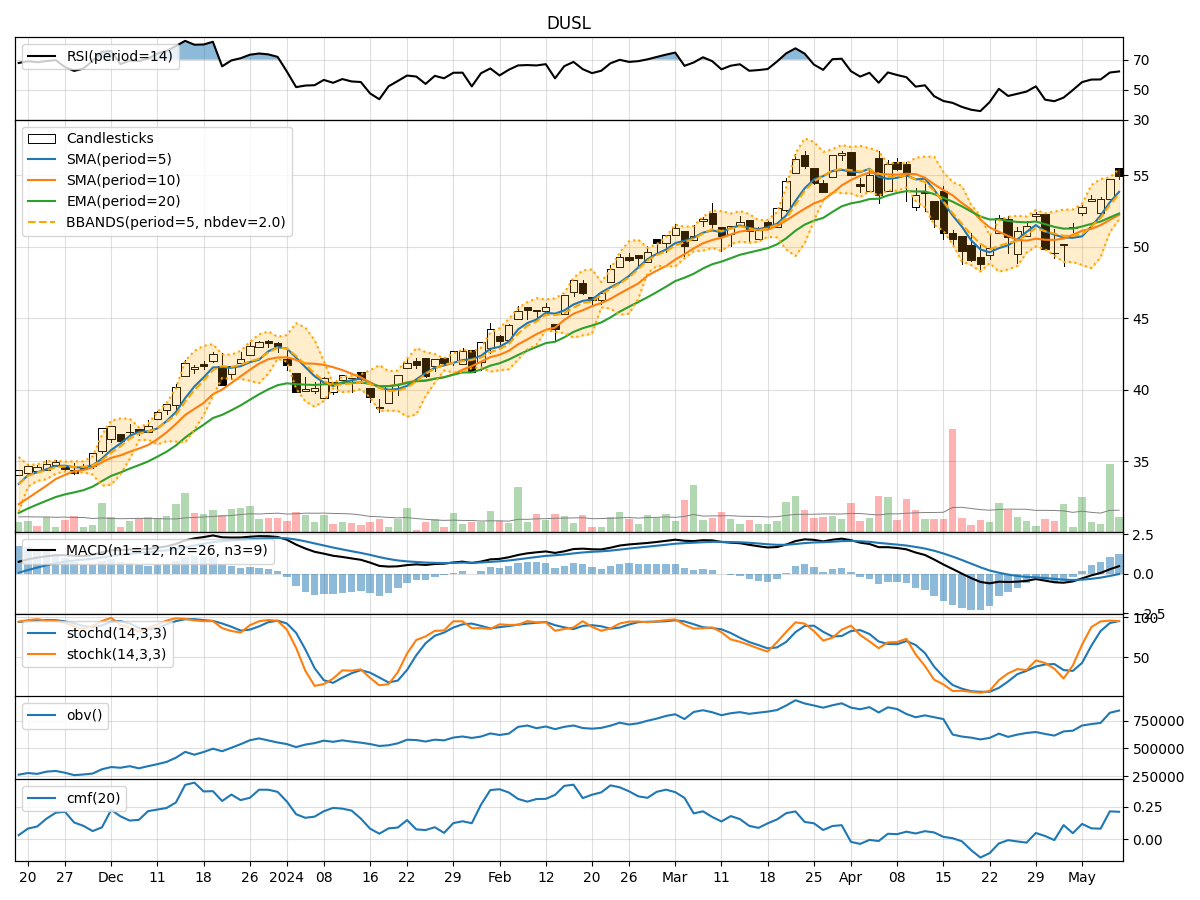
- Moving Averages (MA): The 5-day Moving Average has been consistently rising, indicating a bullish trend in the short term.
- MACD: The MACD line has been above the signal line, suggesting a bullish momentum.
- RSI: The Relative Strength Index has been increasing, pointing towards a strengthening bullish momentum.
Momentum Analysis:
- Stochastic Oscillator: Both %K and %D have been in the overbought zone, signaling a potential reversal or consolidation.
- Williams %R: The indicator has been in the oversold territory, indicating a possible reversal to the upside.
Volatility Analysis:
- Bollinger Bands: The price has been trading near the upper Bollinger Band, suggesting an overbought condition.
- Volatility Bands: The bands have been narrowing, indicating a potential decrease in volatility.
Volume Analysis:
- On-Balance Volume (OBV): The OBV has been increasing, reflecting accumulation by investors.
- Chaikin Money Flow (CMF): The CMF has been positive, indicating buying pressure in the stock.
Key Observations:
- The trend indicators suggest a strong bullish sentiment in the short term.
- Momentum indicators show signs of potential overbought conditions and a need for caution.
- Volatility indicators point towards a possible decrease in volatility.
- Volume indicators indicate positive accumulation and buying pressure.
Conclusion:
Based on the analysis of the technical indicators, the next few days' possible stock price movement for DUSL is likely to be upward in the short term. However, caution is advised due to the potential overbought conditions indicated by the momentum indicators. Traders may consider taking profits or implementing risk management strategies in case of a reversal. Overall, the bullish trend is expected to continue, but monitoring key levels and indicators is crucial for making informed trading decisions.