Technical Analysis of DVAL 2024-05-10
Overview:
In analyzing the technical indicators for DVAL stock over the last 5 days, we will delve into the trend, momentum, volatility, and volume indicators to provide a comprehensive outlook on the possible stock price movement in the coming days. By examining these key indicators, we aim to offer valuable insights and predictions for potential investors.
Trend Analysis:
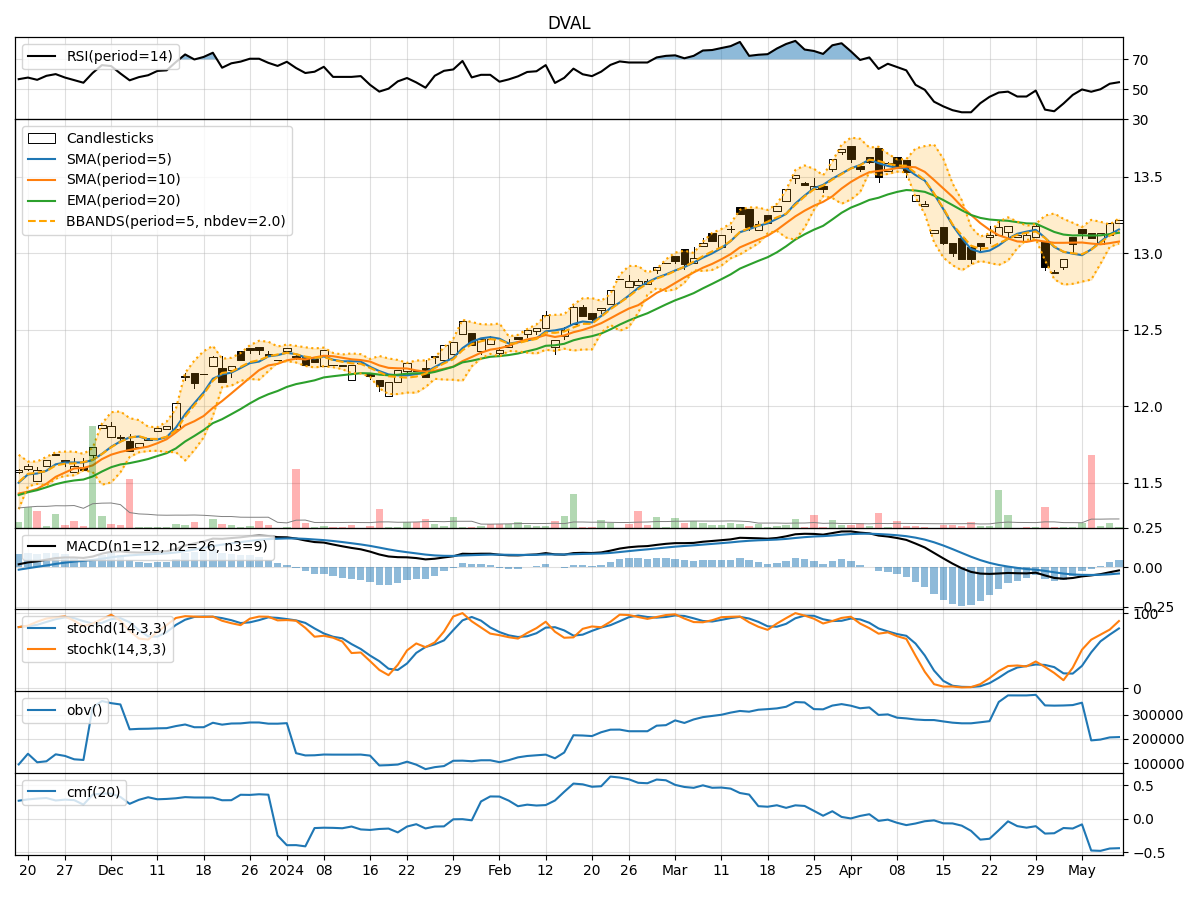
- Moving Averages (MA): The 5-day Moving Average (MA) has been showing a slight uptrend, indicating a positive momentum in the short term.
- MACD: The Moving Average Convergence Divergence (MACD) has been consistently negative, suggesting a bearish trend in the stock price.
- RSI: The Relative Strength Index (RSI) has been fluctuating around the neutral zone, indicating a lack of strong trend direction.
Key Observation: The stock is currently in a consolidation phase with mixed signals from the trend indicators.
Momentum Analysis:
- Stochastic Oscillator: Both %K and %D values have been increasing, reaching overbought levels, signaling a potential reversal or correction.
- Williams %R: The Williams %R is close to the oversold territory, indicating a possible buying opportunity.
Key Observation: Momentum indicators suggest a potential reversal or pullback in the stock price.
Volatility Analysis:
- Bollinger Bands: The Bollinger Bands width has been narrowing, indicating decreasing volatility and a potential breakout in the near future.
Key Observation: Volatility is contracting, which may lead to a significant price movement soon.
Volume Analysis:
- On-Balance Volume (OBV): The OBV has been relatively stable, showing no significant divergence from the price movement.
- Chaikin Money Flow (CMF): The CMF has been negative, indicating selling pressure in the stock.
Key Observation: Volume indicators suggest a lack of strong buying interest in the stock.
Conclusion:
Based on the analysis of the technical indicators, the stock is currently in a consolidation phase with mixed signals from the trend, momentum, and volume indicators. The narrowing Bollinger Bands suggest an imminent breakout, while the momentum indicators point towards a potential reversal or correction in the stock price. Considering the overall scenario, the next few days may see the stock price experiencing increased volatility with a possible downside bias. Investors should closely monitor the price action and key support levels for potential entry or exit points.
Key Recommendations:
- Exercise Caution: Due to the mixed signals and potential reversal indicated by the momentum indicators, investors should be cautious in their trading decisions.
- Monitor Breakout: Keep a close watch on the Bollinger Bands for a potential breakout, which could signal a new trend direction.
- Risk Management: Implement proper risk management strategies to protect against unexpected price movements.
- Wait for Confirmation: Consider waiting for confirmation from multiple indicators before making significant trading decisions.
By incorporating these recommendations and staying vigilant of the evolving market dynamics, investors can navigate the potential price movements of DVAL stock effectively.