Technical Analysis of DVDN 2024-05-10
Overview:
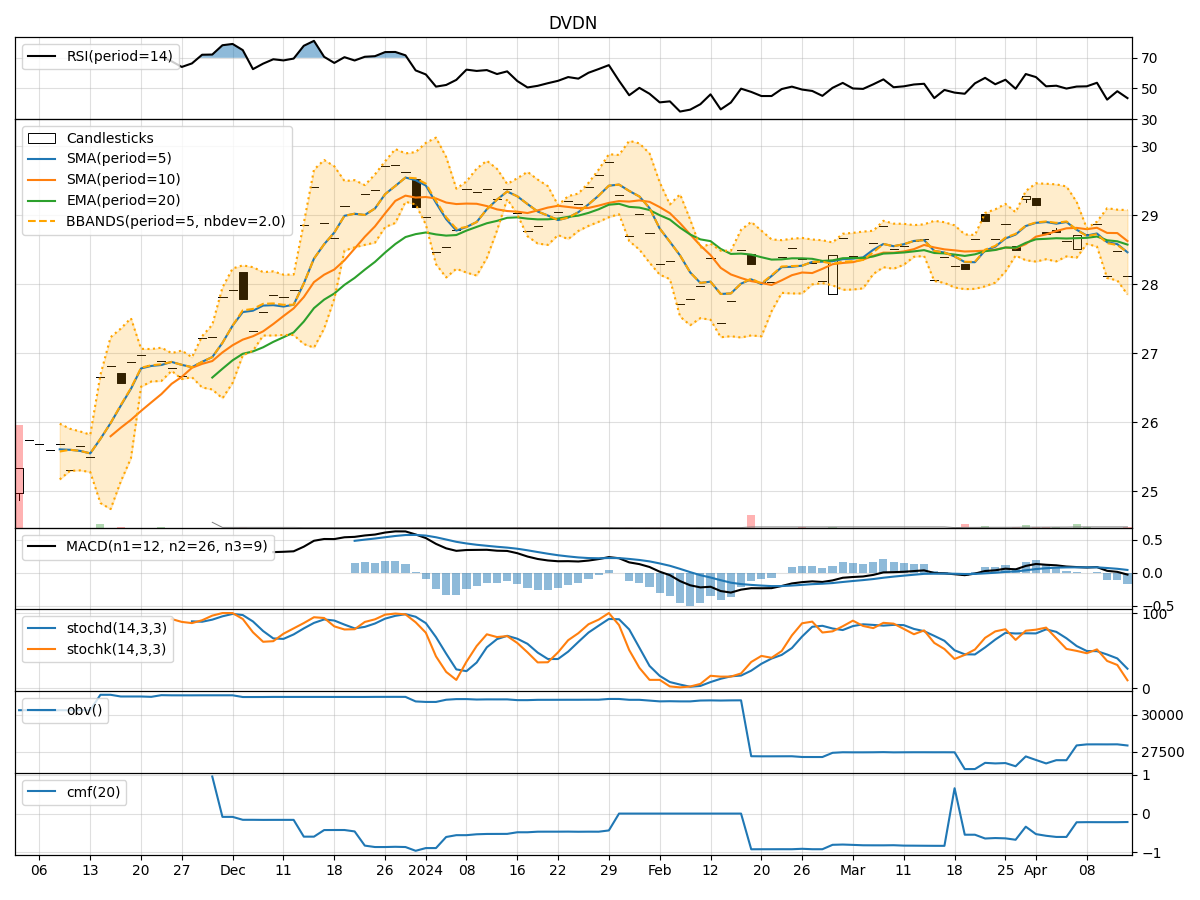
In the last 5 trading days, DVDN stock has shown a relatively stable price movement with minor fluctuations. The technical indicators across trend, momentum, volatility, and volume provide insights into the stock's potential future direction. Let's analyze each category of indicators to determine the possible stock price movement in the next few days.
Trend Indicators:
- Moving Averages (MA): The 5-day Moving Average (MA) has been consistently above the Simple Moving Average (SMA) and Exponential Moving Average (EMA), indicating a bullish trend.
- MACD: The MACD line has been consistently above the signal line, with both lines showing an upward trend, suggesting bullish momentum.
Momentum Indicators:
- RSI: The Relative Strength Index (RSI) has been fluctuating around the 60-65 range, indicating a neutral momentum.
- Stochastic Oscillator: Both %K and %D have been gradually decreasing but still in the overbought zone, suggesting a potential reversal in momentum.
Volatility Indicators:
- Bollinger Bands (BB): The stock price has been trading within the Bollinger Bands, with the bands narrowing, indicating decreasing volatility and a possible consolidation phase.
Volume Indicators:
- On-Balance Volume (OBV): The OBV has been slightly decreasing, indicating a slight selling pressure.
- Chaikin Money Flow (CMF): The CMF has been negative, suggesting outflow of money from the stock.
Key Observations:
- The trend indicators suggest a bullish sentiment, supported by the MACD.
- Momentum indicators show a neutral to slightly bearish outlook, with the RSI hovering in a neutral zone and Stochastic Oscillator signaling a potential reversal.
- Volatility indicators point towards a consolidation phase, with decreasing volatility.
- Volume indicators indicate a slight selling pressure and outflow of money from the stock.
Conclusion:
Based on the analysis of technical indicators, the stock is likely to experience sideways movement or consolidation in the next few days. The bullish trend indicated by moving averages and MACD might be hindered by the neutral to slightly bearish momentum and slight selling pressure observed in volume indicators. Traders should exercise caution and closely monitor key support and resistance levels for potential entry or exit points.