Technical Analysis of DVLU 2024-05-10
Overview:
In analyzing the technical indicators for DVLU over the last 5 days, we will delve into the trend, momentum, volatility, and volume indicators to provide a comprehensive outlook on the possible stock price movement in the coming days. By examining these key aspects, we aim to offer valuable insights and predictions for informed decision-making.
Trend Analysis:
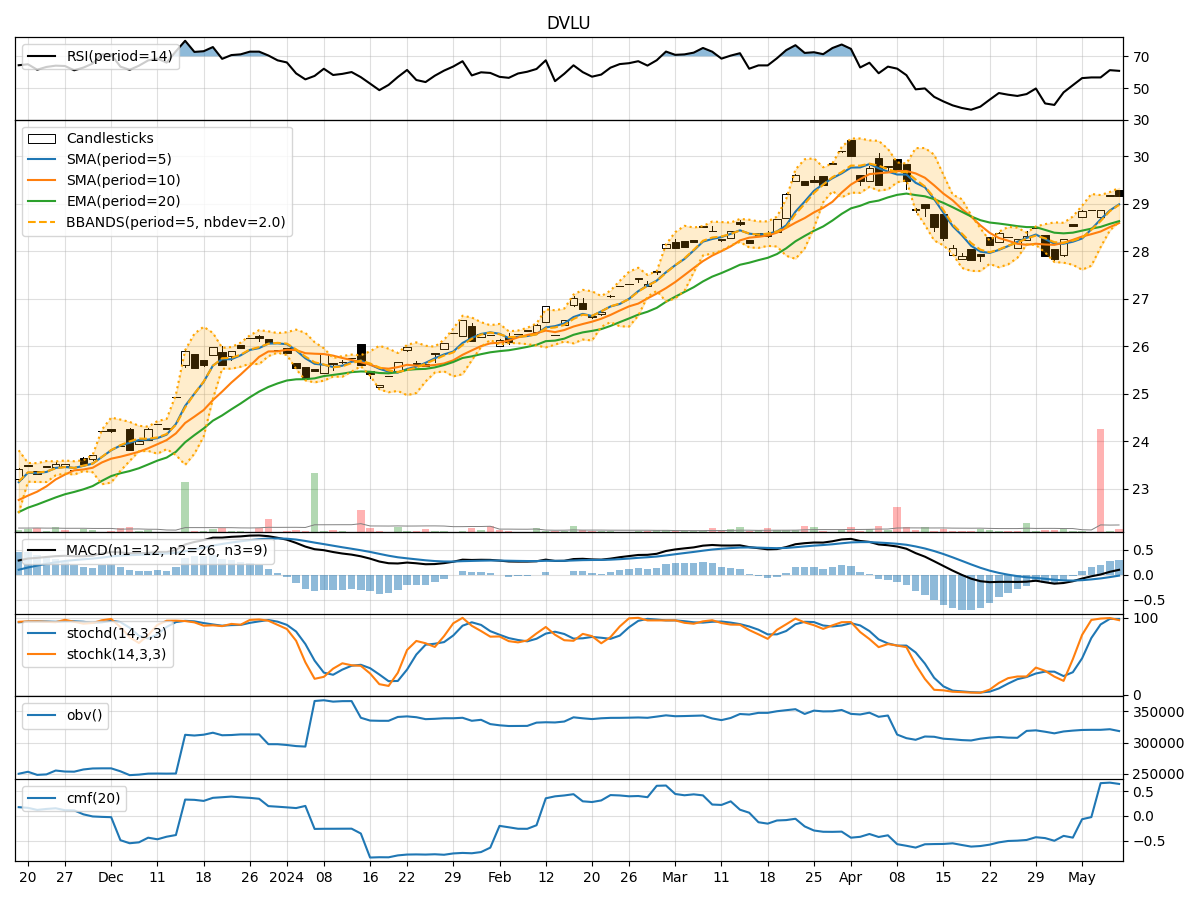
- Moving Averages (MA): The 5-day MA has been consistently above the closing prices, indicating a short-term uptrend.
- MACD: The MACD line has been above the signal line, suggesting bullish momentum.
- RSI: The RSI has been fluctuating around the 60-70 range, indicating a balanced market sentiment.
Key Observation: The trend indicators suggest a bullish sentiment in the short term.
Momentum Analysis:
- Stochastic Oscillator: Both %K and %D have been in the overbought territory, signaling a potential reversal.
- Williams %R: The indicator has shown oversold conditions, hinting at a possible buying opportunity.
Key Observation: Momentum indicators point towards a potential reversal or consolidation phase.
Volatility Analysis:
- Bollinger Bands (BB): The stock price has been trading within the bands, indicating normal volatility.
Key Observation: Volatility remains stable, with no significant deviations from the bands.
Volume Analysis:
- On-Balance Volume (OBV): The OBV has shown mixed signals, reflecting indecision among market participants.
- Chaikin Money Flow (CMF): The CMF has been positive, suggesting buying pressure in the market.
Key Observation: Volume indicators suggest a lack of clear direction in trading activity.
Conclusion:
Based on the analysis of the technical indicators, the next few days' possible stock price movement for DVLU could see sideways consolidation with a slight bullish bias. The trend indicators support a short-term uptrend, while momentum indicators hint at a potential reversal or consolidation phase. Volatility remains stable, and volume indicators show mixed signals, indicating indecision among traders.
Key Conclusion: Expect DVLU to trade sideways with a slight bullish bias in the coming days.