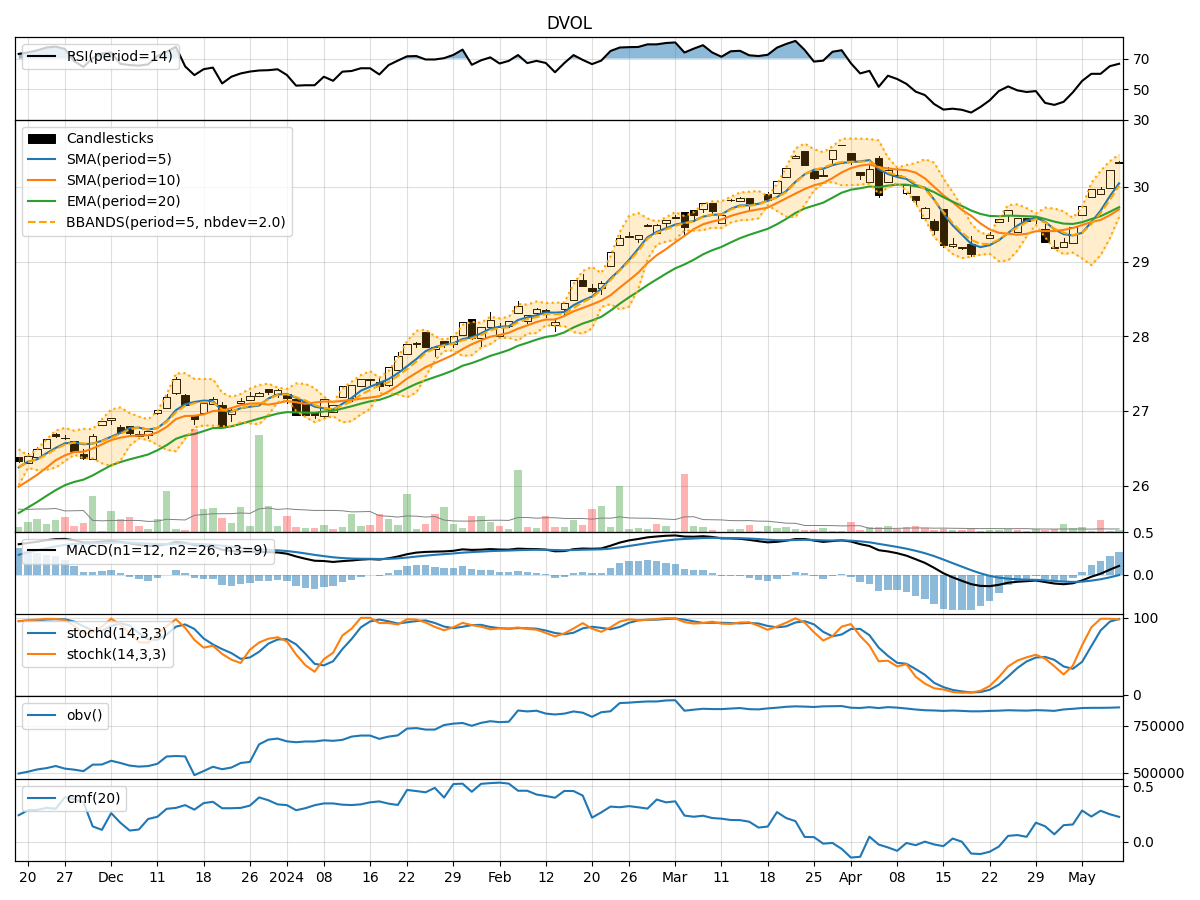
Technical Analysis of DVOL 2024-05-10
Overview:
In the last 5 trading days, the stock has shown a consistent uptrend in both price and volume. The moving averages have been trending upwards, indicating a bullish sentiment. Momentum indicators like RSI and Stochastic oscillators are in overbought territory, suggesting a potential pullback. Volatility indicators show a narrowing of Bollinger Bands, indicating a possible decrease in volatility. Volume indicators like OBV and CMF are positive, supporting the recent price increase.
Trend Indicators:
- Moving averages (MA) are trending upwards, indicating a bullish trend.
- MACD is positive, with the MACD line above the signal line, suggesting bullish momentum.
- The stock is trading above the EMA(20), further confirming the bullish sentiment.
Momentum Indicators:
- RSI is in overbought territory, signaling a potential reversal or consolidation.
- Stochastic oscillators are also in overbought territory, indicating a possible pullback.
- Williams %R (WILLR) is negative, suggesting the stock may be overbought.
Volatility Indicators:
- Bollinger Bands are narrowing, indicating a decrease in volatility.
- The stock price is currently trading near the upper Bollinger Band, which could signal a potential reversal or consolidation.
Volume Indicators:
- On-Balance Volume (OBV) is positive, showing that volume has been higher on up days.
- Chaikin Money Flow (CMF) is positive, indicating buying pressure in the stock.
Key Observations and Opinions:
- Trend: The stock is in a strong uptrend based on moving averages and MACD. Bullish
- Momentum: RSI and Stochastic indicators suggest the stock is overbought and may experience a pullback. Bearish
- Volatility: Bollinger Bands narrowing could indicate a period of consolidation or a potential reversal. Neutral
- Volume: Positive OBV and CMF indicate strong buying pressure. Bullish
Conclusion:
Based on the technical indicators and analysis: - The stock is currently in an upward trend supported by positive volume indicators. - However, momentum indicators suggest the stock is overbought and may experience a pullback in the short term. - The narrowing Bollinger Bands indicate a potential consolidation or reversal in the near future. - Investors should be cautious of a possible short-term correction or consolidation before considering further long positions.
Recommendation:
Given the mixed signals from the technical indicators, it is advisable to wait for a clearer signal before making any significant trading decisions. Traders may consider taking profits on existing positions or implementing risk management strategies to protect gains in case of a pullback. Long-term investors can use any potential pullback as a buying opportunity to add to their positions at more favorable prices.