Technical Analysis of DVY 2024-05-10
Overview:
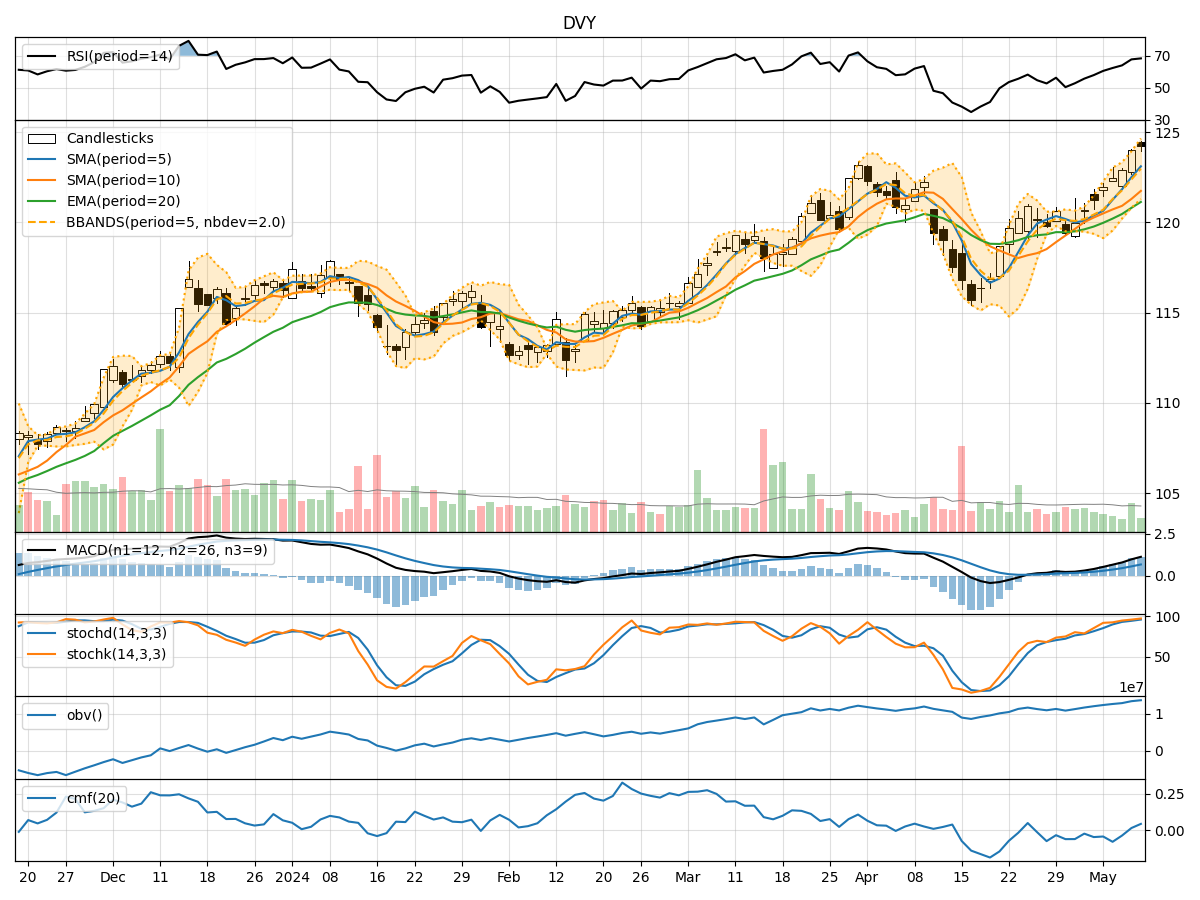
In analyzing the technical indicators for DVY over the last 5 days, we will delve into the trend, momentum, volatility, and volume indicators to provide a comprehensive outlook on the possible stock price movement. By examining these key indicators, we aim to offer valuable insights and predictions for the upcoming trading days.
Trend Indicators:
- Moving Averages (MA): The 5-day moving average has been consistently above the longer-term simple moving average (SMA) and exponential moving average (EMA), indicating a bullish trend.
- MACD: The MACD line has been consistently above the signal line, with both lines showing an upward trend, suggesting bullish momentum.
- RSI: The Relative Strength Index has been trending upwards, indicating increasing buying pressure.
Momentum Indicators:
- Stochastic Oscillator: Both %K and %D lines of the Stochastic Oscillator have been in the overbought zone, suggesting a strong bullish momentum.
- Williams %R: The Williams %R has been fluctuating in the oversold and overbought zones, indicating potential reversals in the price movement.
Volatility Indicators:
- Bollinger Bands: The price has been trading within the upper Bollinger Band, indicating an overbought condition. However, the bands have been widening, suggesting increasing volatility.
- Average True Range (ATR): ATR has been relatively stable, indicating consistent price movements without significant spikes.
Volume Indicators:
- On-Balance Volume (OBV): The OBV has shown a slight increase over the last 5 days, indicating accumulation by investors.
- Chaikin Money Flow (CMF): The CMF has been negative, suggesting some selling pressure in the market.
Key Observations and Opinions:
- Trend: The trend indicators suggest a strong bullish sentiment in the market.
- Momentum: Momentum indicators indicate a robust bullish momentum, but caution is advised as some indicators show overbought conditions.
- Volatility: Volatility has been increasing, which could lead to larger price swings in the near future.
- Volume: The volume indicators show mixed signals, with OBV slightly positive and CMF negative, indicating a divergence in market sentiment.
Conclusion:
Based on the analysis of the technical indicators, the next few days' possible stock price movement for DVY is likely to continue in an upward direction with increased volatility. However, traders should be cautious of potential overbought conditions and monitor for any signs of reversal in momentum indicators. Overall, the outlook remains bullish in the short term, but a consolidation phase or a minor pullback could be expected before further upside potential.