Technical Analysis of DVYA 2024-05-10
Overview:
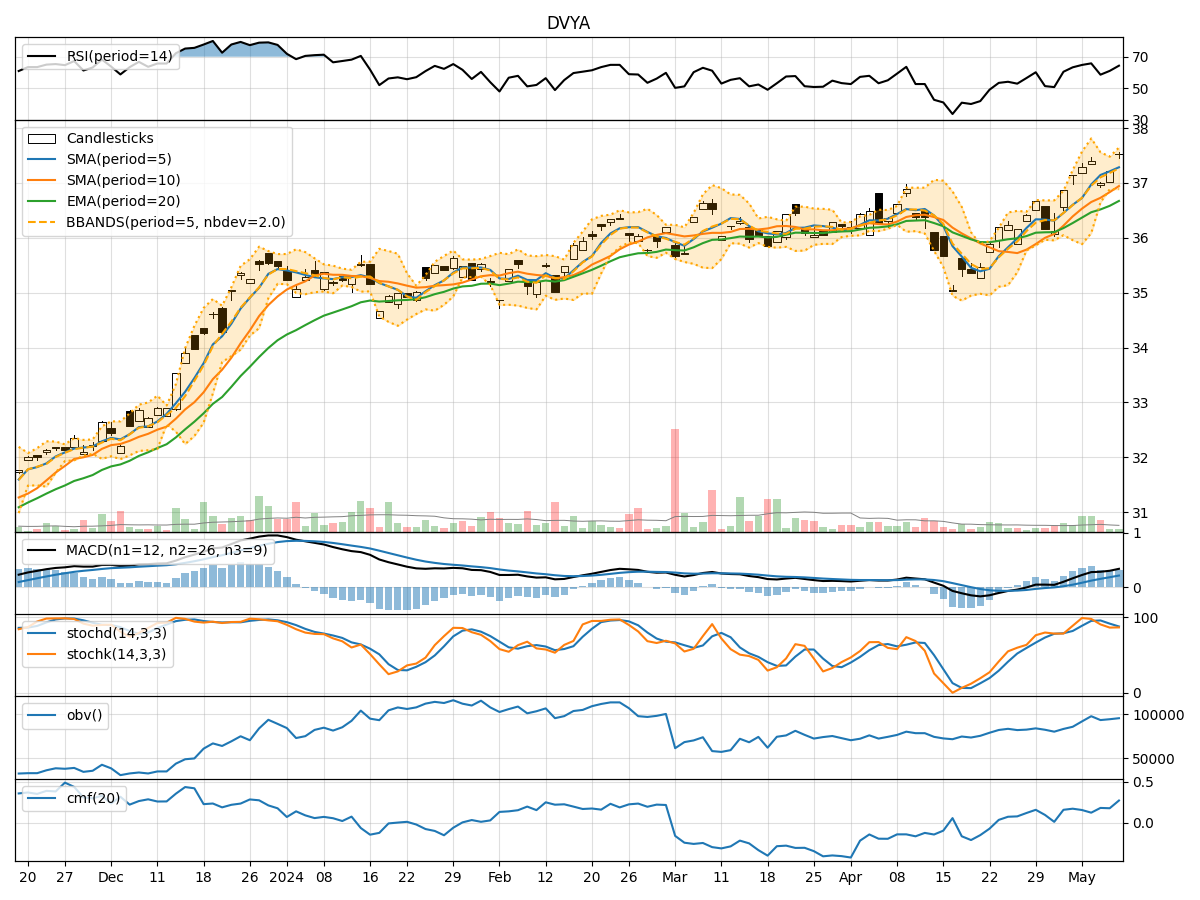
In analyzing the technical indicators for DVYA over the last 5 days, we will delve into the trend, momentum, volatility, and volume indicators to provide a comprehensive outlook on the possible stock price movement in the coming days. By examining these key indicators, we aim to offer valuable insights and predictions for informed decision-making.
Trend Analysis:
- Moving Averages (MA): The 5-day MA has been consistently above the closing prices, indicating a bullish trend.
- MACD: The MACD line has been above the signal line, suggesting a bullish momentum.
- EMA: The EMA has been trending upwards, supporting the bullish sentiment.
Key Observation: The trend indicators point towards an upward trend in the stock price.
Momentum Analysis:
- RSI: The RSI values have been in the range of 50-70, indicating a moderate bullish momentum.
- Stochastic Oscillator: Both %K and %D have been fluctuating but generally above 50, suggesting a bullish momentum.
- Williams %R: The values have been around -20, indicating an overbought condition.
Key Observation: Momentum indicators suggest a bullish sentiment in the stock.
Volatility Analysis:
- Bollinger Bands: The stock price has been trading within the upper Bollinger Band, indicating high volatility.
- Bollinger %B: The %B values have been above 0.5, indicating an overbought condition.
Key Observation: Volatility indicators suggest a high volatility environment for the stock.
Volume Analysis:
- On-Balance Volume (OBV): The OBV has shown mixed signals, with some days experiencing selling pressure.
- Chaikin Money Flow (CMF): The CMF values have been positive, indicating buying pressure.
Key Observation: Volume indicators suggest a mixed sentiment in terms of buying and selling pressure.
Conclusion:
Based on the analysis of the technical indicators, the overall outlook for DVYA in the next few days is bullish with a high volatility environment. The trend and momentum indicators support a continued upward movement in the stock price, while the volatility indicators suggest caution due to the high volatility levels. The volume indicators, although mixed, do not negate the overall bullish sentiment.
Recommendation:
Considering the bullish trend and momentum, investors may consider buying opportunities in DVYA, but it is essential to monitor the high volatility levels and set appropriate risk management strategies. Traders should be cautious of potential pullbacks and consider entering positions at favorable levels to maximize returns.
Key Conclusion: Upward trend with bullish momentum, but exercise caution due to high volatility.