Technical Analysis of DWAT 2024-05-10
Overview:
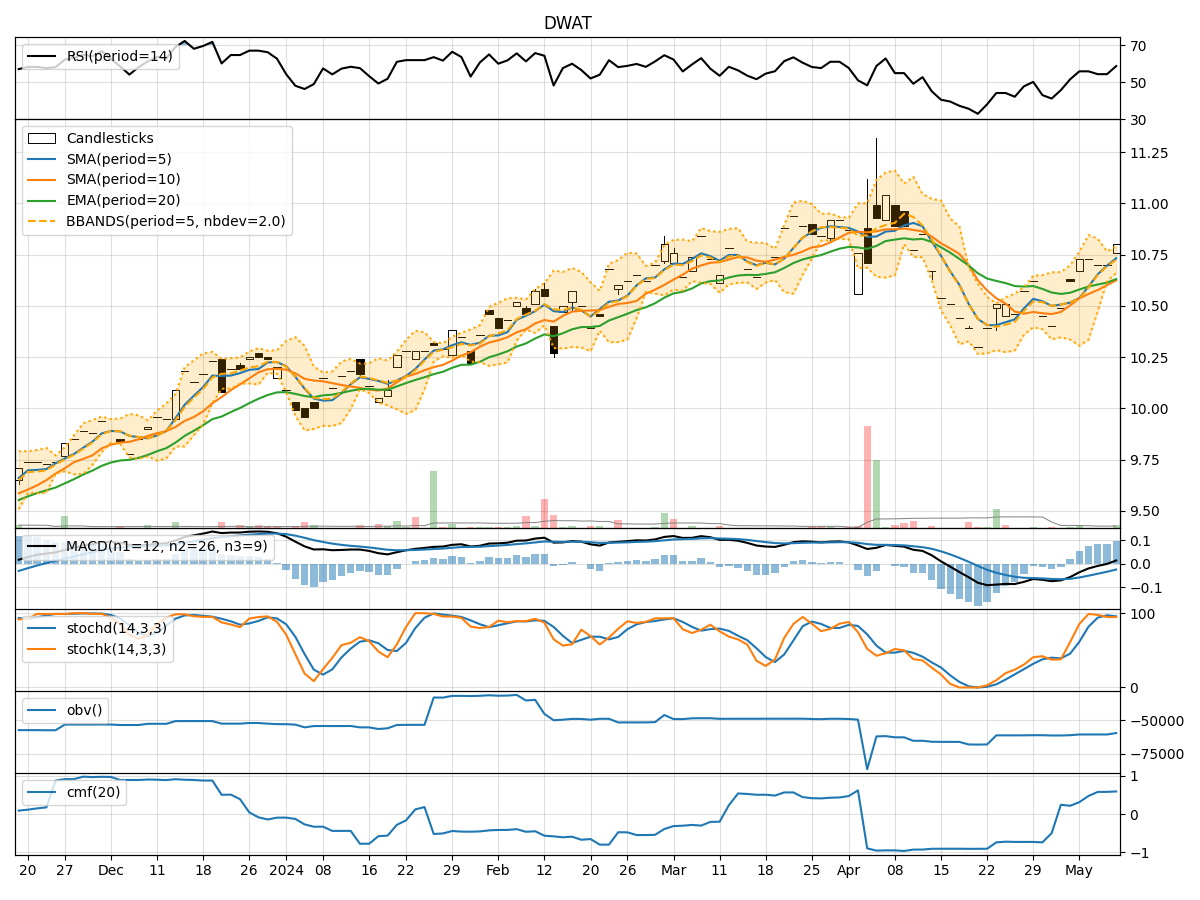
In analyzing the technical indicators for DWAT over the last 5 days, we will delve into the trend, momentum, volatility, and volume indicators to provide a comprehensive outlook on the possible stock price movement in the coming days.
Trend Analysis:
- Moving Averages (MA): The 5-day Moving Average (MA) has been consistently above the Simple Moving Average (SMA) and Exponential Moving Average (EMA), indicating a bullish trend.
- MACD: The MACD line has been consistently above the signal line, with both lines showing an upward trend, suggesting bullish momentum.
- RSI: The Relative Strength Index (RSI) has been fluctuating around the 50 level, indicating a neutral stance in terms of momentum.
Momentum Analysis:
- Stochastic Oscillator: The Stochastic Oscillator has been hovering in the overbought territory, suggesting a potential reversal or consolidation phase.
- Williams %R: The Williams %R indicator has been fluctuating around the oversold level, indicating a potential reversal in the short term.
Volatility Analysis:
- Bollinger Bands (BB): The Bollinger Bands have been narrowing, indicating decreasing volatility and a possible period of consolidation.
- BB %B: The %B indicator has been fluctuating around the midline, suggesting a lack of clear direction in terms of volatility.
Volume Analysis:
- On-Balance Volume (OBV): The OBV indicator has been relatively stable, indicating a balance between buying and selling pressure.
- Chaikin Money Flow (CMF): The CMF has been gradually increasing, indicating a potential inflow of money into the stock.
Key Observations:
- The trend indicators suggest a bullish bias in the short term.
- Momentum indicators show signs of potential reversal or consolidation.
- Volatility indicators point towards a period of consolidation and decreasing volatility.
- Volume indicators indicate a balance between buying and selling pressure with a slight inflow of money.
Conclusion:
Based on the analysis of the technical indicators, the next few days for DWAT could see sideways movement with a slight bullish bias. Traders should be cautious of potential reversals indicated by the momentum indicators and monitor the volatility for any breakout opportunities. Overall, the stock is likely to consolidate in the near term before potentially resuming its upward trend.