Technical Analysis of DWLD 2024-05-10
Overview:
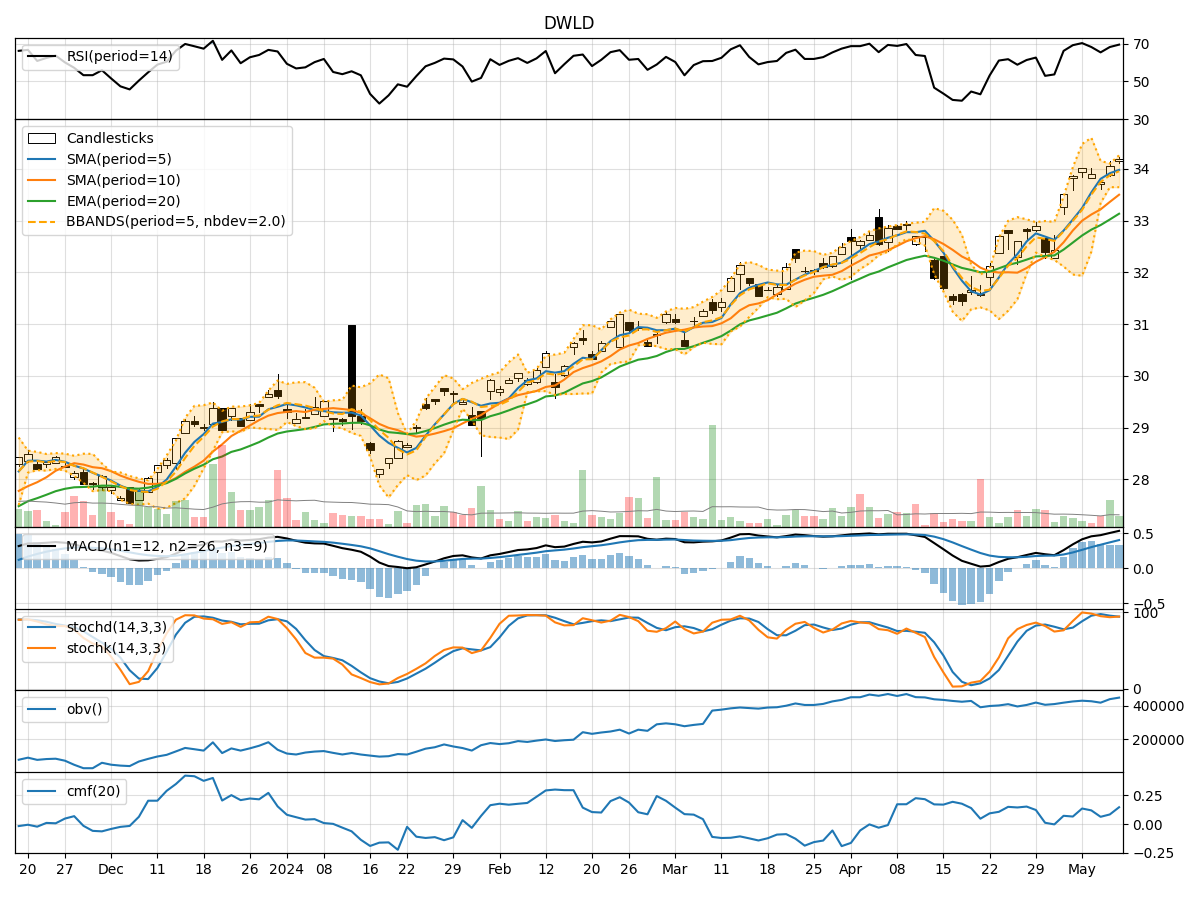
In analyzing the technical indicators for DWLD over the last 5 days, we will delve into the trend, momentum, volatility, and volume indicators to provide a comprehensive assessment of the stock's potential price movement. By examining these key factors, we aim to offer valuable insights and predictions for the next few days.
Trend Analysis:
- Moving Averages (MA): The 5-day Moving Average (MA) has been trending above the Simple Moving Average (SMA) and Exponential Moving Average (EMA), indicating a bullish trend.
- MACD: The Moving Average Convergence Divergence (MACD) and its signal line have been consistently positive, suggesting upward momentum.
- Conclusion: The trend indicators point towards an upward trend in the stock price.
Momentum Analysis:
- RSI: The Relative Strength Index (RSI) has been fluctuating in the overbought territory, indicating strong buying pressure.
- Stochastic Oscillator: Both %K and %D have been relatively high, suggesting bullish momentum.
- Conclusion: Momentum indicators signal a bullish sentiment in the market.
Volatility Analysis:
- Bollinger Bands (BB): The stock price has been trading within the Bollinger Bands, with the bands narrowing, indicating decreasing volatility.
- Conclusion: Volatility indicators suggest a consolidation phase with reduced price fluctuations.
Volume Analysis:
- On-Balance Volume (OBV): The OBV has shown a slight increase, indicating accumulation by investors.
- Chaikin Money Flow (CMF): The CMF has been positive, reflecting buying pressure.
- Conclusion: Volume indicators support a bullish outlook for the stock.
Overall Conclusion:
Based on the analysis of trend, momentum, volatility, and volume indicators, the collective assessment points towards a bullish outlook for DWLD in the next few days. The stock is likely to experience an upward price movement, supported by strong buying pressure, positive trend indicators, and favorable volume dynamics. Traders and investors may consider taking long positions or holding onto existing positions to capitalize on the anticipated price appreciation.
Key Takeaways:
- The technical indicators align in signaling a bullish sentiment for DWLD.
- Investors should monitor the price action closely to capitalize on potential gains.
- It is essential to consider risk management strategies despite the positive outlook.
By combining the insights from various technical indicators, we can gain a holistic understanding of the stock's potential trajectory, enabling informed decision-making in the dynamic stock market environment.