Technical Analysis of DWMF 2024-05-10
Overview:
In analyzing the technical indicators for DWMF stock over the last 5 days, we will delve into the trend, momentum, volatility, and volume indicators to provide a comprehensive outlook on the possible stock price movement in the coming days. By examining these key indicators, we aim to offer valuable insights and predictions for potential investors.
Trend Indicators:
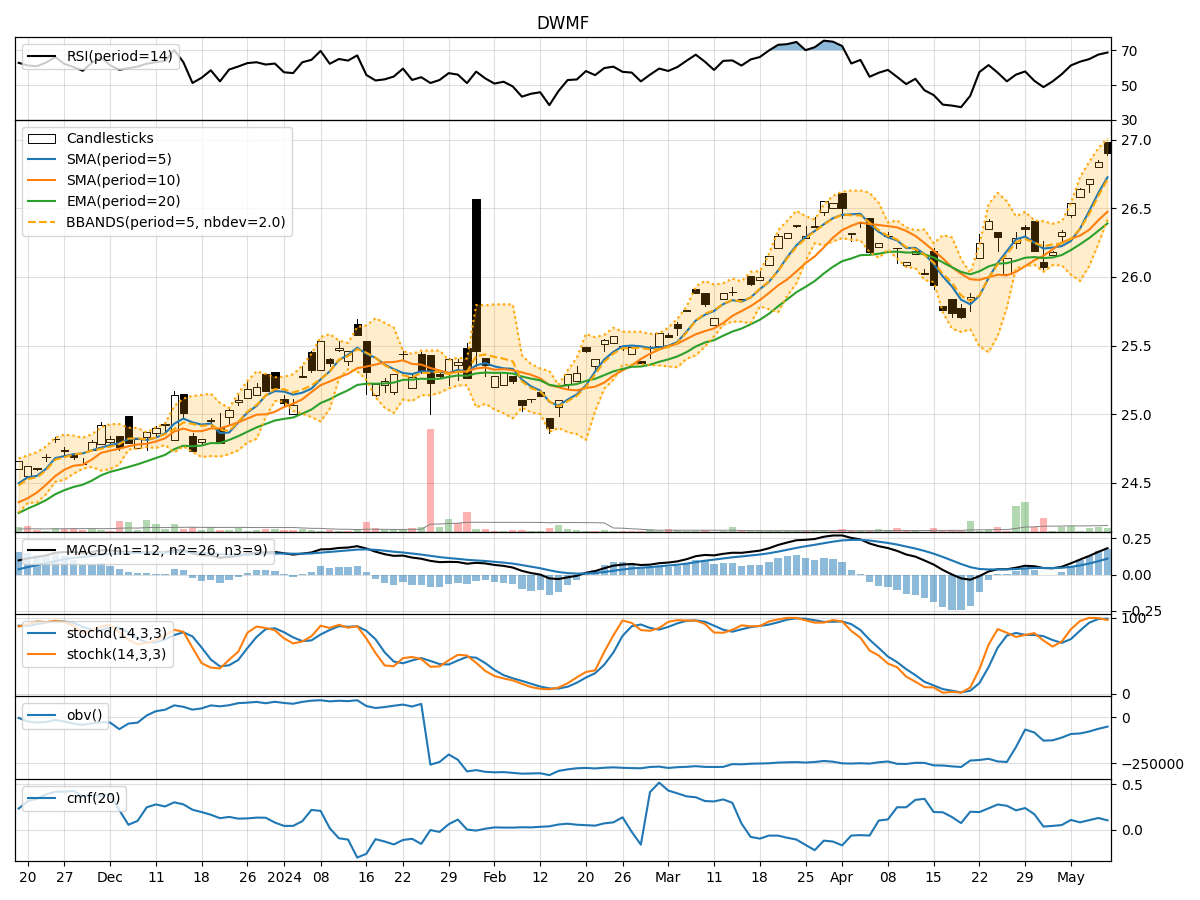
- Moving Averages (MA): The 5-day moving average has been consistently above the simple moving average (SMA) and exponential moving average (EMA), indicating a bullish trend.
- MACD: The MACD line has been consistently above the signal line, with both lines showing an upward trend, suggesting bullish momentum.
- MACD Histogram: The histogram has been increasing over the past 5 days, indicating strengthening bullish momentum.
Momentum Indicators:
- RSI: The Relative Strength Index (RSI) has been trending upwards and is currently in the overbought territory, suggesting a strong bullish momentum.
- Stochastic Oscillator: Both %K and %D lines of the Stochastic Oscillator are in the overbought zone, indicating a potential reversal or consolidation.
- Williams %R: The Williams %R is in the oversold territory, signaling a potential reversal to the upside.
Volatility Indicators:
- Bollinger Bands: The stock price has been trading within the upper Bollinger Band (BBU) range, indicating an overbought condition.
- Bollinger Band Width: The Band Width has been narrowing, suggesting a decrease in volatility and a possible period of consolidation.
- Bollinger Band %B: The %B indicator is above 0.8, indicating an overbought condition.
Volume Indicators:
- On-Balance Volume (OBV): The OBV has been steadily increasing over the past 5 days, indicating strong buying pressure.
- Chaikin Money Flow (CMF): The CMF has been positive, suggesting that money is flowing into the stock.
Conclusion:
Based on the analysis of the technical indicators, the stock of DWMF is currently exhibiting strong bullish momentum across various indicators. The trend is bullish, supported by moving averages and MACD. However, the Stochastic Oscillator and Williams %R suggest a potential reversal or consolidation in the short term due to overbought conditions. The Bollinger Bands also indicate an overbought scenario, while the OBV and CMF point towards continued buying interest.
Recommendation:
Given the overall bullish sentiment in the technical indicators, it is likely that the stock price of DWMF may experience a short-term consolidation or a minor pullback before potentially resuming its upward trajectory. Investors should closely monitor the Stochastic Oscillator and Williams %R for signs of a reversal, while also keeping an eye on the Bollinger Bands for potential volatility changes. Long-term investors can consider holding their positions, while short-term traders may look for opportunities to enter at lower levels during a potential pullback.
Key Conclusion:
- Short-Term View: Consolidation or Minor Pullback
- Long-Term View: Bullish
By combining the insights from trend, momentum, volatility, and volume indicators, investors can make informed decisions aligned with the current market dynamics of DWMF stock.