Technical Analysis of DWSH 2024-05-10
Overview:
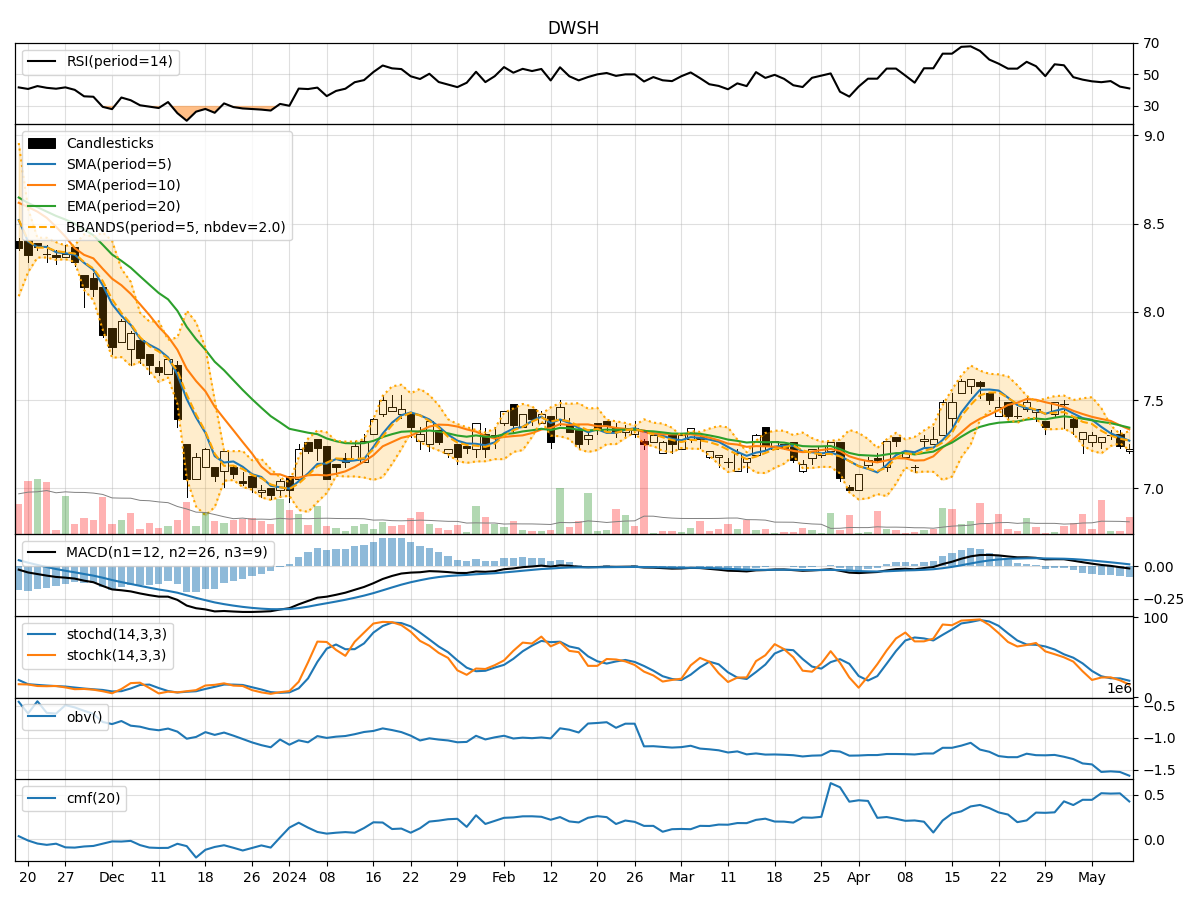
In analyzing the technical indicators for DWSH over the last 5 days, we will delve into the trend, momentum, volatility, and volume indicators to provide a comprehensive outlook on the possible stock price movement in the coming days. By examining these key aspects, we aim to offer valuable insights and predictions to guide investment decisions.
Trend Analysis:
- Moving Averages (MA): The 5-day MA has been declining, indicating a short-term bearish trend.
- MACD: The MACD line has been consistently below the signal line, suggesting bearish momentum.
- EMA: The EMA has also been trending downwards, aligning with the bearish sentiment in the short term.
Momentum Analysis:
- RSI: The RSI has been decreasing, reflecting weakening momentum.
- Stochastic Oscillator: Both %K and %D have been falling, indicating a bearish momentum.
- Williams %R: The indicator has been in oversold territory, signaling a potential reversal.
Volatility Analysis:
- Bollinger Bands: The bands have been narrowing, indicating decreasing volatility.
- Bollinger %B: The %B indicator has been hovering around the middle, suggesting a lack of extreme price movements.
Volume Analysis:
- On-Balance Volume (OBV): The OBV has been declining, indicating selling pressure.
- Chaikin Money Flow (CMF): The CMF has been relatively stable, showing a neutral money flow trend.
Key Observations:
- The trend indicators point towards a bearish sentiment in the short term.
- Momentum indicators suggest weakening momentum and potential for a reversal.
- Volatility has been decreasing, indicating a lack of significant price movements.
- Volume indicators show selling pressure but with a stable money flow trend.
Conclusion:
Based on the analysis of the technical indicators, the outlook for DWSH in the next few days is bearish. The trend, momentum, and volume indicators all align with a potential downward movement in the stock price. Traders and investors should exercise caution and consider shorting or staying on the sidelines until a clearer bullish signal emerges.