Technical Analysis of DWUS 2024-05-10
Overview:
In analyzing the technical indicators for DWUS over the last 5 days, we will delve into the trend, momentum, volatility, and volume indicators to provide a comprehensive assessment of the stock's potential price movement. By examining these key factors, we aim to offer valuable insights and predictions for the next few days.
Trend Indicators:
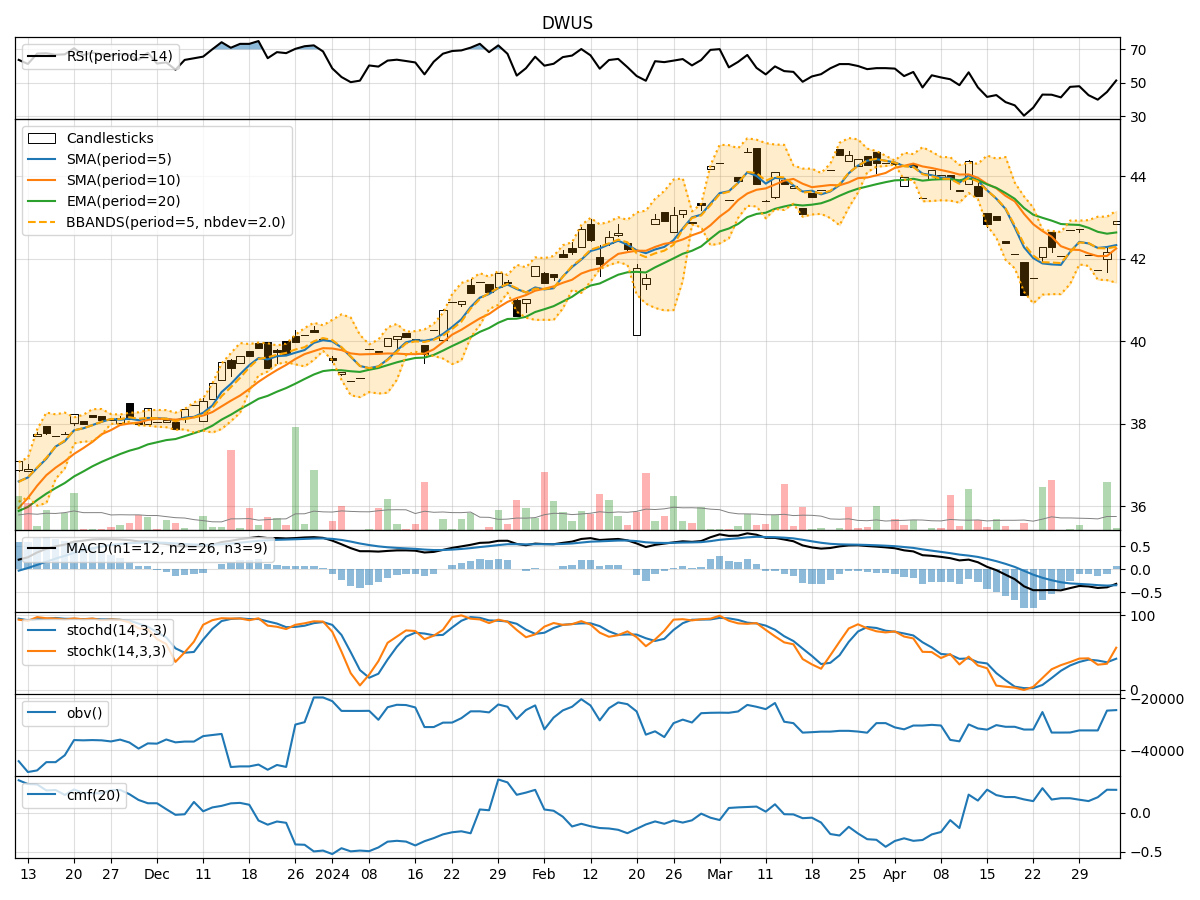
- Moving Averages (MA): The 5-day MA has been consistently above the 10-day SMA, indicating a short-term bullish trend. The EMA(20) has been trending upwards, suggesting a positive momentum in the stock price.
- MACD: The MACD line has been above the signal line for the past 5 days, indicating a bullish trend. The MACD histogram has also been increasing, further supporting the bullish sentiment.
Momentum Indicators:
- RSI: The RSI has been gradually increasing and is currently in the overbought territory, suggesting a strong bullish momentum.
- Stochastic Oscillator: Both %K and %D lines of the Stochastic Oscillator are in the overbought zone, indicating a potential reversal or consolidation in the near future.
Volatility Indicators:
- Bollinger Bands (BB): The stock price has been trading within the upper Bollinger Band, indicating an overbought condition. The bands are relatively narrow, suggesting a period of low volatility.
- Bollinger %B: The %B indicator is close to 1, indicating that the stock price is at the upper band, signaling a potential pullback or consolidation.
Volume Indicators:
- On-Balance Volume (OBV): The OBV has been increasing over the last 5 days, indicating strong buying pressure in the stock.
- Chaikin Money Flow (CMF): The CMF(20) has been positive, suggesting that money is flowing into the stock.
Key Observations and Opinions:
- Trend: The trend indicators suggest a strong bullish sentiment in the stock, supported by moving averages and MACD.
- Momentum: The momentum indicators indicate an overbought condition, which might lead to a potential reversal or consolidation.
- Volatility: The stock is currently in an overbought condition based on Bollinger Bands, and the %B indicator signals a possible pullback.
- Volume: The increasing OBV and positive CMF indicate strong buying interest in the stock.
Conclusion:
Based on the analysis of the technical indicators, the stock is currently in an overbought condition with strong bullish momentum. However, the overbought signals from the Stochastic Oscillator and Bollinger Bands %B suggest a potential pullback or consolidation in the near future. Traders should exercise caution and consider taking profits or implementing risk management strategies in anticipation of a possible correction.