Technical Analysis of DWX 2024-05-10
Overview:
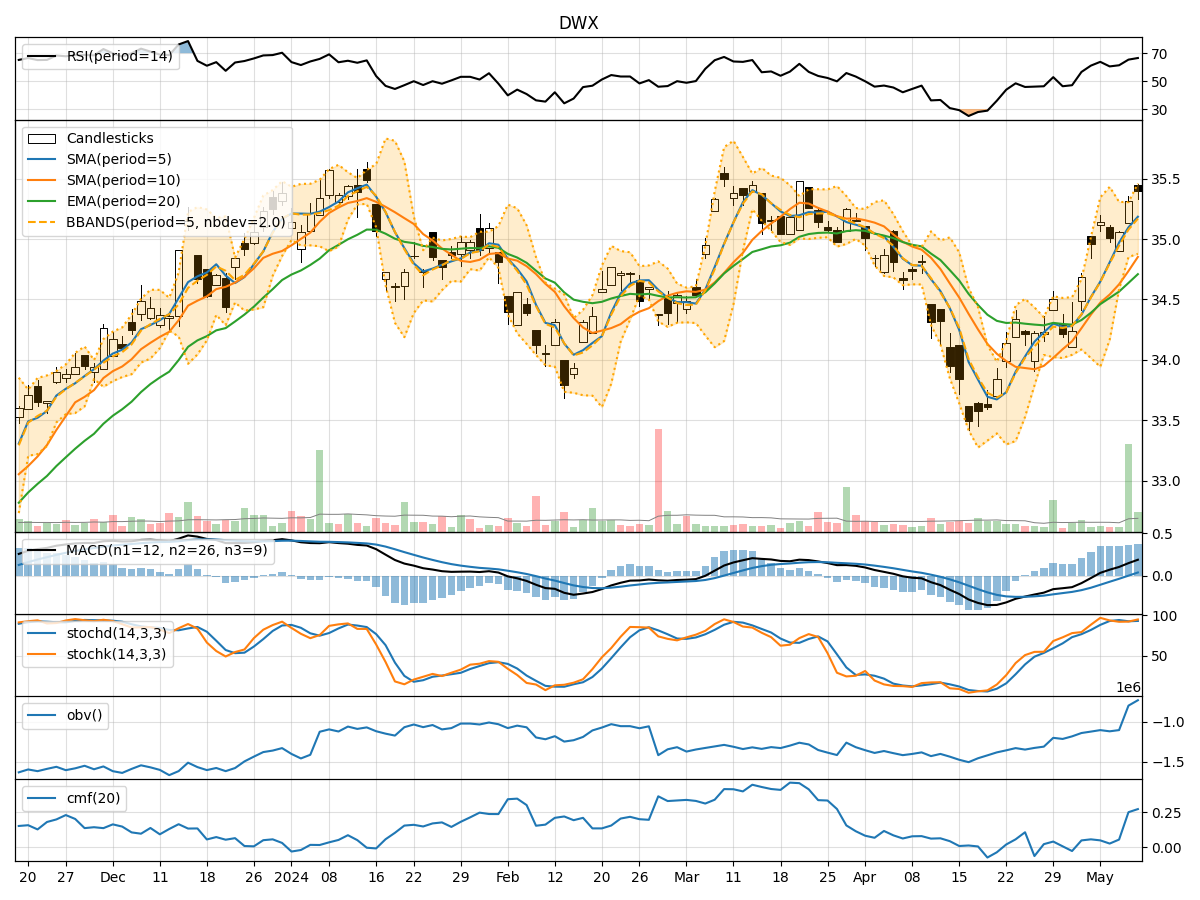
In the last 5 trading days, DWX stock has shown a consistent uptrend in its price, supported by increasing volumes. The trend indicators suggest a positive momentum, with moving averages and MACD showing bullish signals. Momentum indicators like RSI and Stochastic oscillators indicate a strong buying momentum. Volatility indicators show a narrowing Bollinger Band, indicating a potential breakout. Volume indicators also support the bullish sentiment with increasing On-Balance Volume (OBV) and Chaikin Money Flow (CMF) values.
Trend Indicators Analysis:
- Moving Averages (MA): The 5-day MA is consistently above the longer-term SMAs, indicating a short-term bullish trend.
- MACD: The MACD line is above the signal line, indicating a bullish momentum.
- EMA: The EMA is trending upwards, supporting the bullish sentiment.
Momentum Indicators Analysis:
- RSI: The RSI is in the overbought territory but has room for further upside, suggesting strong buying pressure.
- Stochastic Oscillators: Both %K and %D lines are in the overbought zone, indicating a strong uptrend.
- Williams %R: The indicator is in the oversold region, suggesting a potential reversal to the upside.
Volatility Indicators Analysis:
- Bollinger Bands (BB): The narrowing of the Bollinger Bands suggests a period of consolidation followed by a potential breakout.
- Bollinger Band %B (BBP): The %B value is approaching the upper band, indicating a bullish momentum.
Volume Indicators Analysis:
- On-Balance Volume (OBV): The increasing OBV suggests that buyers are more aggressive, supporting the uptrend.
- Chaikin Money Flow (CMF): The rising CMF value indicates strong buying pressure and accumulation of the stock.
Key Observations:
- Trend: The stock is in a strong uptrend supported by moving averages and MACD.
- Momentum: Momentum indicators show a strong buying pressure with potential for further upside.
- Volatility: The narrowing Bollinger Bands suggest a period of consolidation before a potential breakout.
- Volume: Increasing OBV and CMF values indicate strong buying interest and accumulation.
Conclusion:
Based on the comprehensive analysis of technical indicators, the next few days' possible stock price movement for DWX is bullish. The stock is likely to continue its uptrend, supported by strong momentum, increasing volumes, and a potential breakout indicated by volatility indicators. Traders and investors may consider entering long positions or holding onto existing positions to benefit from the expected upward movement in the stock price.