Technical Analysis of DXD 2024-05-10
Overview:
In analyzing the technical indicators for DXD over the last 5 days, we will delve into the trend, momentum, volatility, and volume indicators to provide a comprehensive outlook on the possible stock price movement. By examining these key aspects, we aim to offer valuable insights and predictions for the upcoming days.
Trend Analysis:
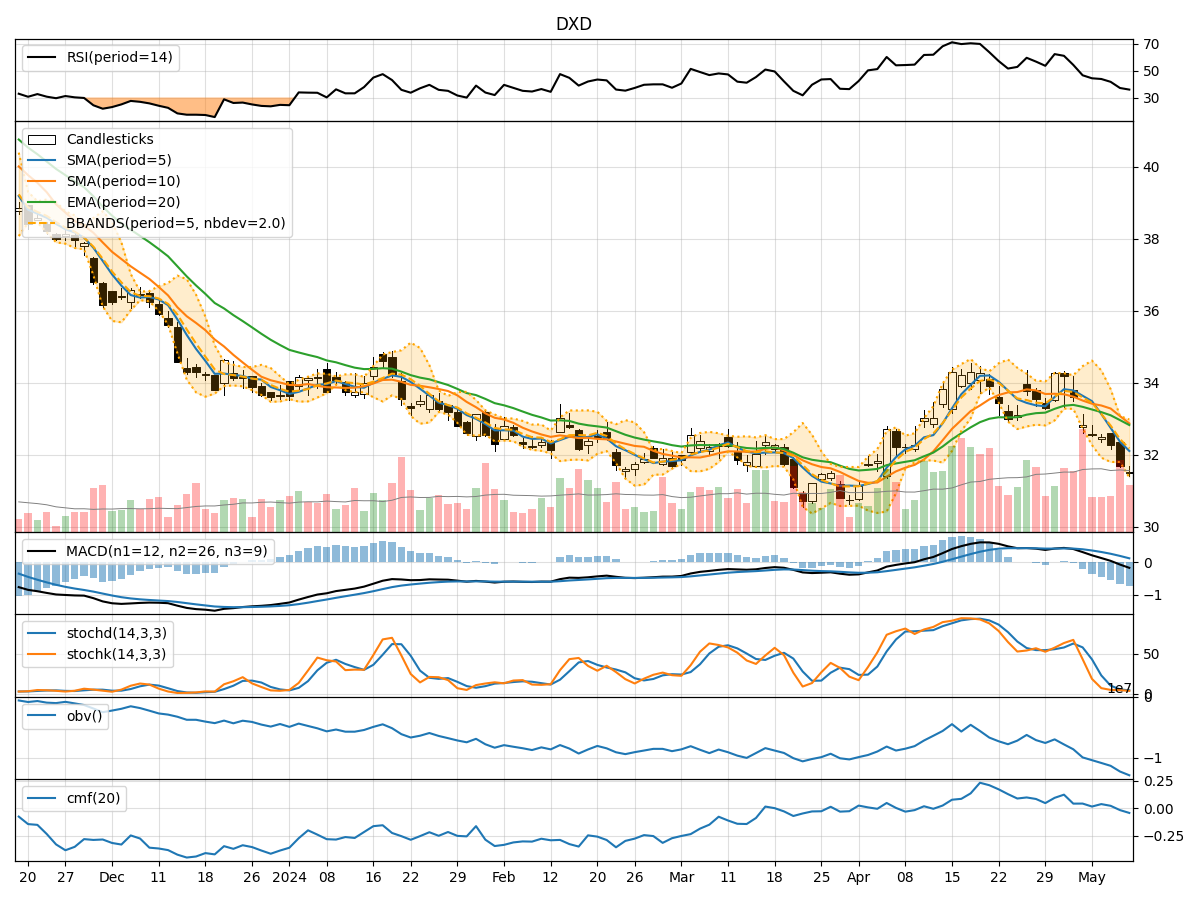
- Moving Averages (MA): The 5-day Moving Average (MA) has been consistently below the Simple Moving Average (SMA) and Exponential Moving Average (EMA) over the past 5 days, indicating a downward trend.
- MACD: The MACD line has been below the signal line, with decreasing values, suggesting bearish momentum in the stock price.
Momentum Analysis:
- RSI: The Relative Strength Index (RSI) has been declining and is currently below 50, indicating bearish momentum in the stock.
- Stochastic Oscillator: Both %K and %D have been decreasing, with values in oversold territory, signaling a bearish sentiment.
Volatility Analysis:
- Bollinger Bands (BB): The stock price has been consistently trading below the middle Bollinger Band (BBM), indicating a downward trend with low volatility.
Volume Analysis:
- On-Balance Volume (OBV): The OBV has been consistently decreasing over the last 5 days, suggesting selling pressure in the stock.
- Chaikin Money Flow (CMF): The CMF has also been negative, indicating outflow of money from the stock.
Key Observations:
- The trend, momentum, and volume indicators all point towards a bearish outlook for DXD.
- The stock is currently in a downtrend with increasing selling pressure and decreasing momentum.
- Volatility remains low, indicating a stable but bearish price movement.
Conclusion:
Based on the analysis of the technical indicators, the next few days for DXD are likely to see a continuation of the downward trend. Investors should exercise caution as the stock shows bearish signals across various indicators. It is advisable to consider risk management strategies and closely monitor the price action for any potential reversals.