Technical Analysis of DXJS 2024-05-10
Overview:
In analyzing the technical indicators for DXJS over the last 5 days, we will delve into the trend, momentum, volatility, and volume indicators to provide a comprehensive outlook on the possible stock price movement in the coming days. By examining these key aspects, we aim to offer valuable insights and predictions for potential investors.
Trend Indicators:
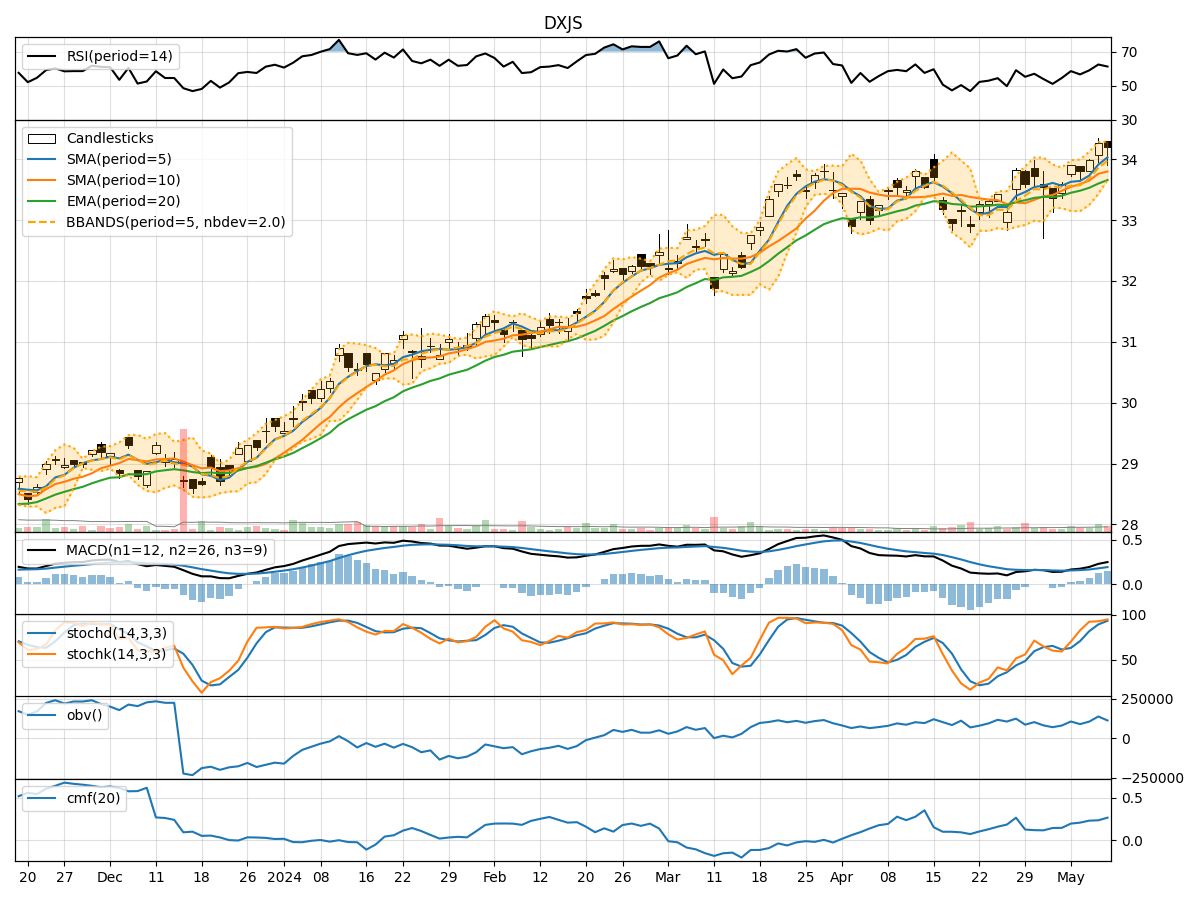
- Moving Averages (MA): The 5-day MA has been consistently above the closing prices, indicating a short-term uptrend.
- MACD: The MACD line has been positive and increasing, suggesting bullish momentum.
- Relative Strength Index (RSI): The RSI has been fluctuating around the overbought territory, indicating strong buying pressure.
Momentum Indicators:
- Stochastic Oscillator: Both %K and %D have been in the overbought zone, signaling a potential reversal.
- Williams %R (WillR): The indicator has been in the oversold region, suggesting a possible buying opportunity.
Volatility Indicators:
- Bollinger Bands (BB): The price has been trading within the bands, indicating normal volatility.
- Bollinger Band Width (BBW): The BBW has been relatively stable, suggesting consistent price movement.
Volume Indicators:
- On-Balance Volume (OBV): The OBV has shown an overall positive trend, indicating accumulation by investors.
- Chaikin Money Flow (CMF): The CMF has been increasing, reflecting buying pressure.
Key Observations:
- The trend indicators suggest a bullish sentiment in the short term.
- Momentum indicators show mixed signals with potential for a reversal.
- Volatility remains stable, indicating a balanced market.
- Volume indicators point towards accumulation and buying pressure.
Conclusion:
Based on the analysis of the technical indicators, the next few days for DXJS are likely to see continued upward movement in the stock price. The bullish trend supported by positive MACD and RSI, along with increasing OBV and CMF, indicates a favorable outlook for investors. However, caution is advised as the stochastic oscillator signals potential overbought conditions, and a slight pullback or consolidation may occur before further upside. Overall, the stock is poised for further gains in the near term.