Technical Analysis of DYFI 2024-05-10
Overview:
In analyzing the technical indicators for DYFI over the last 5 days, we will delve into the trend, momentum, volatility, and volume indicators to provide a comprehensive outlook on the possible stock price movement. By examining these key aspects, we aim to offer valuable insights and predictions for the upcoming days.
Trend Analysis:
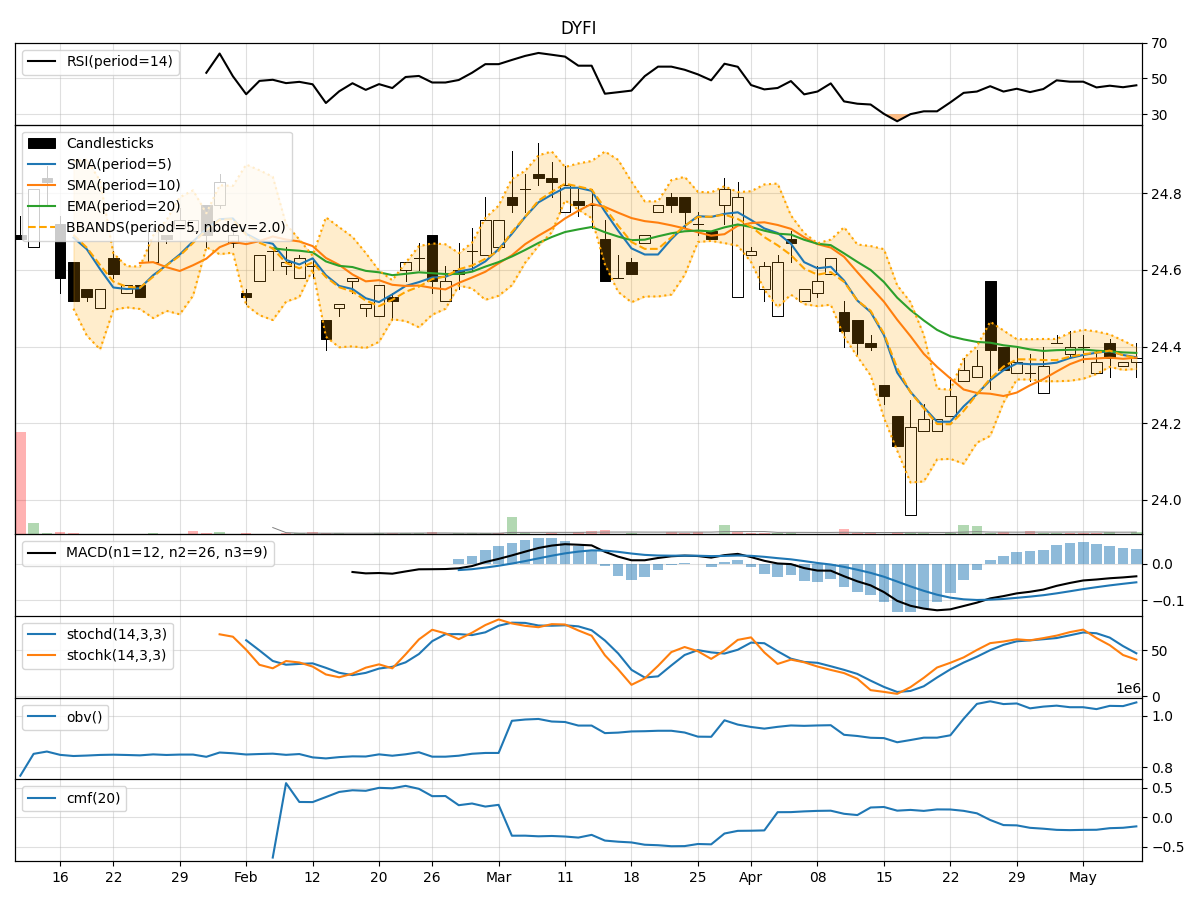
- Moving Averages (MA): The 5-day Moving Average (MA) has been hovering around the closing price, indicating a relatively stable trend.
- MACD: The Moving Average Convergence Divergence (MACD) has been consistently negative, suggesting a bearish momentum in the short term.
- EMA: The Exponential Moving Average (EMA) has been slightly declining, reflecting a potential weakening trend.
Momentum Analysis:
- RSI: The Relative Strength Index (RSI) has been fluctuating around the neutral zone, indicating indecision in the market.
- Stochastic Oscillator: Both %K and %D have been decreasing, signaling a potential bearish momentum.
- Williams %R: The Williams %R is in oversold territory, suggesting a possible reversal in the short term.
Volatility Analysis:
- Bollinger Bands: The Bollinger Bands have been narrowing, indicating decreasing volatility in the stock price.
- Bollinger %B: The %B indicator has been fluctuating within a range, reflecting a lack of clear direction in price movement.
Volume Analysis:
- On-Balance Volume (OBV): The OBV has been relatively flat, suggesting a balance between buying and selling pressure.
- Chaikin Money Flow (CMF): The CMF has been negative, indicating a lack of strong buying interest in the stock.
Key Observations:
- The trend indicators suggest a slightly bearish sentiment in the short term.
- Momentum indicators point towards a potential bearish momentum.
- Volatility indicators indicate decreasing volatility in the stock price.
- Volume indicators show a lack of significant buying interest in the stock.
Conclusion:
Based on the analysis of the technical indicators, the overall outlook for DYFI in the next few days leans towards a bearish sentiment. The trend is showing signs of weakness, momentum is bearish, volatility is decreasing, and volume is relatively flat. Therefore, it is likely that the stock price may experience a downward movement in the upcoming days. Traders and investors should exercise caution and consider risk management strategies in their decision-making process.