Technical Analysis of DYLG 2024-05-10
Overview:
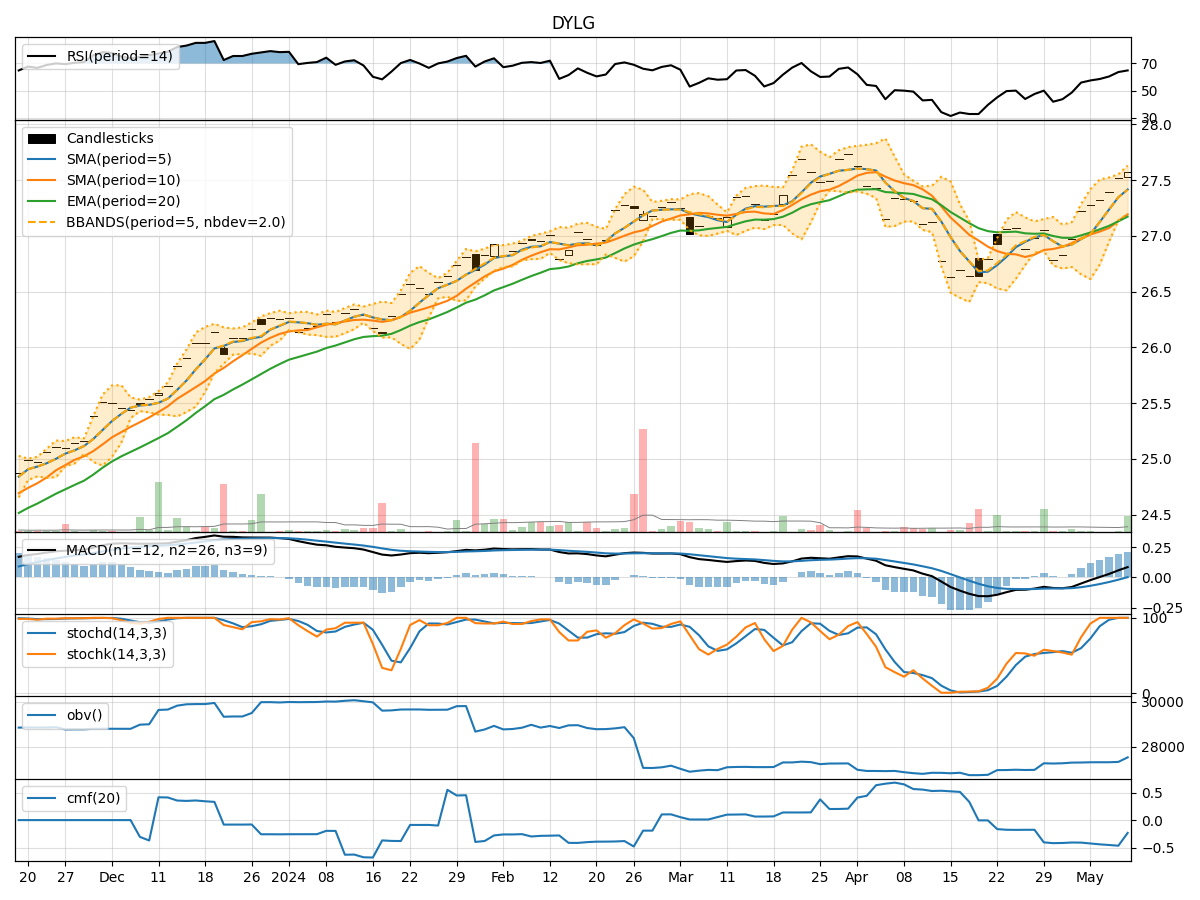
In the last 5 trading days, DYLG stock has shown a consistent uptrend in its price, with increasing volumes. The trend indicators such as Moving Averages (MA), MACD, and Momentum indicators like RSI and Stochastic oscillators all suggest a bullish sentiment. Volatility indicators like Bollinger Bands and Volume indicators also support the bullish outlook. Based on the technical analysis of these indicators, the next few days are likely to see continued upward movement in DYLG stock price.
Trend Indicators Analysis:
- Moving Averages (MA): The 5-day MA has been consistently above the 10-day SMA, indicating a short-term bullish trend. The EMA(20) is also trending upwards, supporting the bullish sentiment.
- MACD: The MACD line has been consistently above the signal line, with both lines in positive territory. The MACD histogram has been increasing, indicating strengthening bullish momentum.
Momentum Indicators Analysis:
- RSI: The RSI has been in the overbought region above 70, indicating strong buying momentum. However, it's important to note that sustained overbought conditions may lead to a potential pullback.
- Stochastic Oscillators: Both %K and %D have been at 100, suggesting strong bullish momentum. This indicates that the stock is in a strong uptrend.
Volatility Indicators Analysis:
- Bollinger Bands: The stock price has been consistently trading above the middle Bollinger Band, indicating an uptrend. The narrowing of the bands suggests decreasing volatility, which could lead to a breakout in the upward direction.
- Bollinger Band %B: The %B indicator has been above 0.5, indicating that the stock is trading above the middle band and is in a bullish phase.
Volume Indicators Analysis:
- On-Balance Volume (OBV): The OBV has been steadily increasing over the last 5 days, indicating strong buying pressure. This aligns with the price increase and suggests that the uptrend is supported by increasing volumes.
- Chaikin Money Flow (CMF): The CMF has been negative but improving, indicating that money flow is starting to turn positive. This suggests that buying pressure is increasing.
Conclusion:
Based on the comprehensive analysis of trend, momentum, volatility, and volume indicators, the overall outlook for DYLG stock is strongly bullish. The technical indicators collectively suggest that the stock is in an uptrend with strong momentum and increasing buying pressure. Therefore, the next few days are likely to see further upward movement in the stock price. Traders and investors may consider taking advantage of this bullish trend by looking for opportunities to enter long positions or hold existing positions to capitalize on the potential price appreciation.