Technical Analysis of DYNF 2024-05-10
Overview:
In analyzing the technical indicators for DYNF over the last 5 days, we will delve into the trend, momentum, volatility, and volume indicators to provide a comprehensive outlook on the possible stock price movement in the coming days. By examining these key indicators, we aim to offer valuable insights and predictions to guide investment decisions.
Trend Indicators:
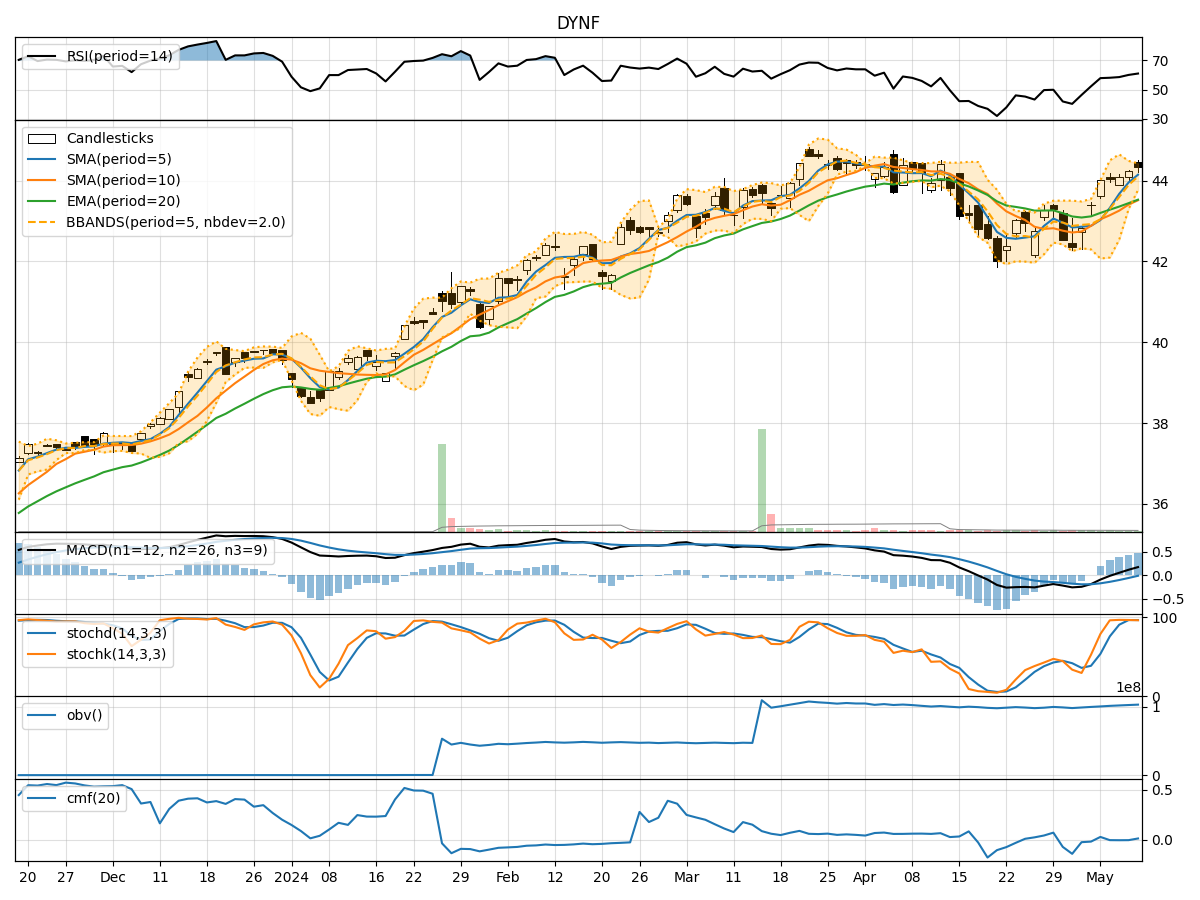
- Moving Averages (MA): The 5-day MA has been consistently rising, indicating a bullish trend in the short term.
- MACD: The MACD line has been above the signal line for the past 5 days, suggesting a bullish momentum.
- RSI: The RSI has been increasing, reflecting strengthening buying pressure.
Key Observation: The trend indicators point towards a bullish sentiment in the stock price movement.
Momentum Indicators:
- Stochastic Oscillator: Both %K and %D have been consistently high, indicating strong upward momentum.
- Williams %R: The indicator has been fluctuating but generally in the oversold territory, suggesting potential buying opportunities.
Key Observation: Momentum indicators support a bullish outlook for the stock.
Volatility Indicators:
- Bollinger Bands (BB): The bands have been narrowing, indicating decreasing volatility.
- BB %B: The %B has been increasing, suggesting a potential breakout.
Key Observation: Volatility is decreasing, which could lead to a consolidation phase before a potential breakout.
Volume Indicators:
- On-Balance Volume (OBV): The OBV has been steadily increasing, indicating accumulation by investors.
- Chaikin Money Flow (CMF): The CMF has been mostly negative, signaling some selling pressure.
Key Observation: Volume indicators show a mixed signal with accumulation in OBV but selling pressure in CMF.
Conclusion:
Based on the analysis of trend, momentum, volatility, and volume indicators, the overall outlook for DYNF in the next few days is bullish. The stock is likely to continue its upward trend supported by strong momentum and decreasing volatility. However, investors should be cautious of potential consolidation phases before a breakout. It is advisable to monitor key levels and wait for confirmation signals before making trading decisions.
In conclusion, the technical analysis suggests a bullish bias for DYNF in the upcoming days, but it is essential to combine this analysis with fundamental factors and market dynamics for a well-rounded investment strategy.