Technical Analysis of DYTA 2024-05-10
Overview:
In analyzing the provided technical indicators for the last 5 days of DYTA stock, we will delve into the trend, momentum, volatility, and volume indicators to forecast the possible stock price movement in the upcoming days. By examining these key indicators, we aim to provide a comprehensive and insightful analysis to guide your investment decisions.
Trend Analysis:
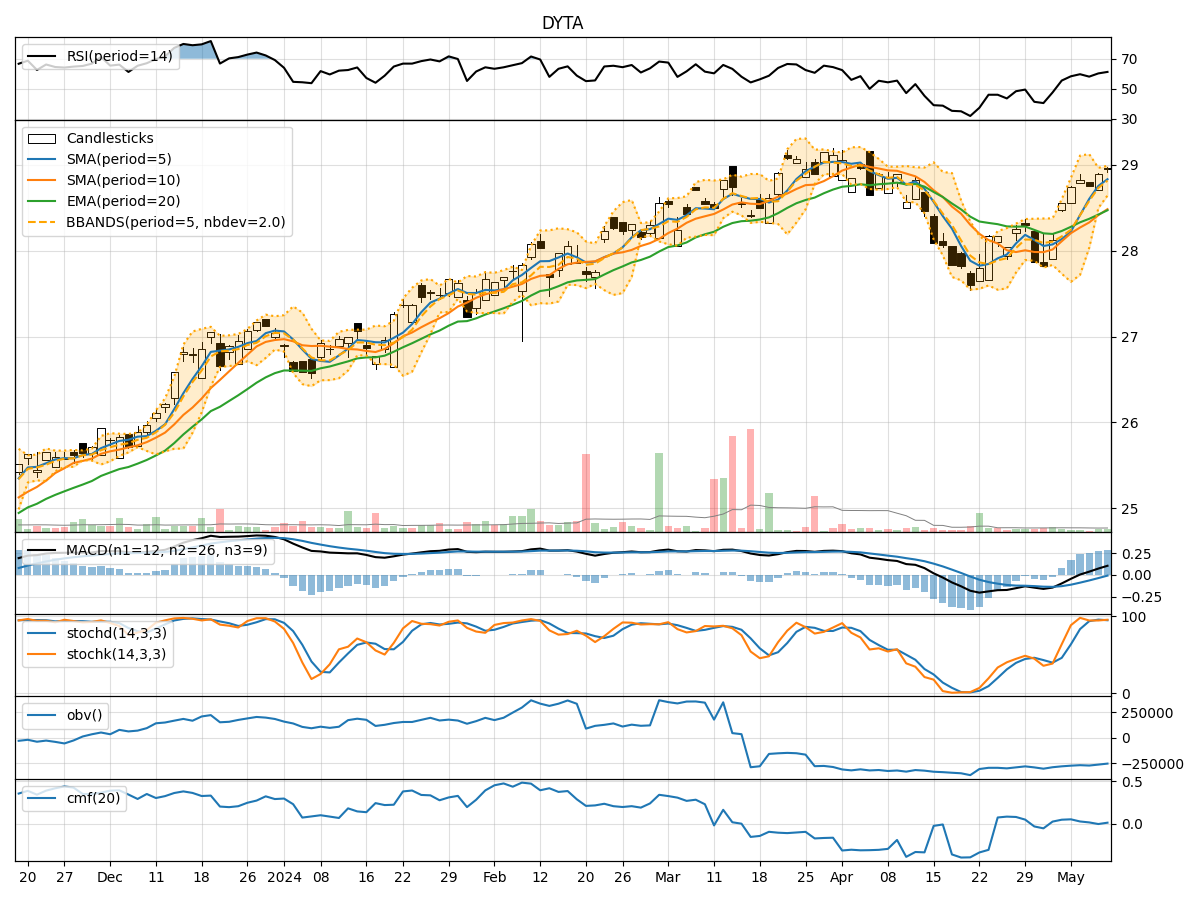
- Moving Averages (MA): The 5-day Moving Average (MA) has been consistently above the Simple Moving Average (SMA) and Exponential Moving Average (EMA), indicating a bullish trend.
- MACD: The MACD line has been consistently above the signal line, with the MACD histogram showing an increasing positive trend, suggesting bullish momentum.
Momentum Analysis:
- RSI: The Relative Strength Index (RSI) has been trending upwards and is currently in the overbought territory, indicating strong buying momentum.
- Stochastic Oscillator: Both %K and %D lines of the Stochastic Oscillator are in the overbought zone, suggesting a potential reversal or consolidation.
Volatility Analysis:
- Bollinger Bands (BB): The stock price has been trading within the upper Bollinger Band (BBU), indicating high volatility and a potential overbought condition.
- Bollinger Band Width (BBW): The BBW has been narrowing, suggesting a potential decrease in volatility and a period of consolidation.
Volume Analysis:
- On-Balance Volume (OBV): The OBV has been showing a slight decrease, indicating some distribution of the stock.
- Chaikin Money Flow (CMF): The CMF has been positive but decreasing, suggesting weakening buying pressure.
Conclusion:
Based on the analysis of the technical indicators: - Trend: The stock is in a strong bullish trend based on moving averages and MACD. - Momentum: The RSI indicates overbought conditions, while the Stochastic Oscillator suggests a potential reversal or consolidation. - Volatility: The Bollinger Bands signal high volatility and a potential overbought condition, while the narrowing Bollinger Band Width indicates a possible consolidation phase. - Volume: The OBV shows some distribution of the stock, and the decreasing CMF suggests weakening buying pressure.
Overall Assessment:
Considering the bullish trend and momentum, along with the high volatility and overbought signals, there is a likelihood of further upside potential in the stock price in the short term. However, the overbought conditions and weakening buying pressure indicate a need for caution, as a reversal or consolidation phase could be on the horizon. It is advisable to closely monitor the price action and key support/resistance levels for potential entry or exit points.
Recommendation:
- Short Term: Consider taking profits if the stock price continues to rise and monitor for signs of a potential reversal.
- Long Term: Evaluate the overall market conditions and company fundamentals to make informed decisions for long-term investment strategies.
Always remember to conduct thorough research and consider multiple factors before making any investment decisions.