Technical Analysis of EAOK 2024-05-10
Overview:
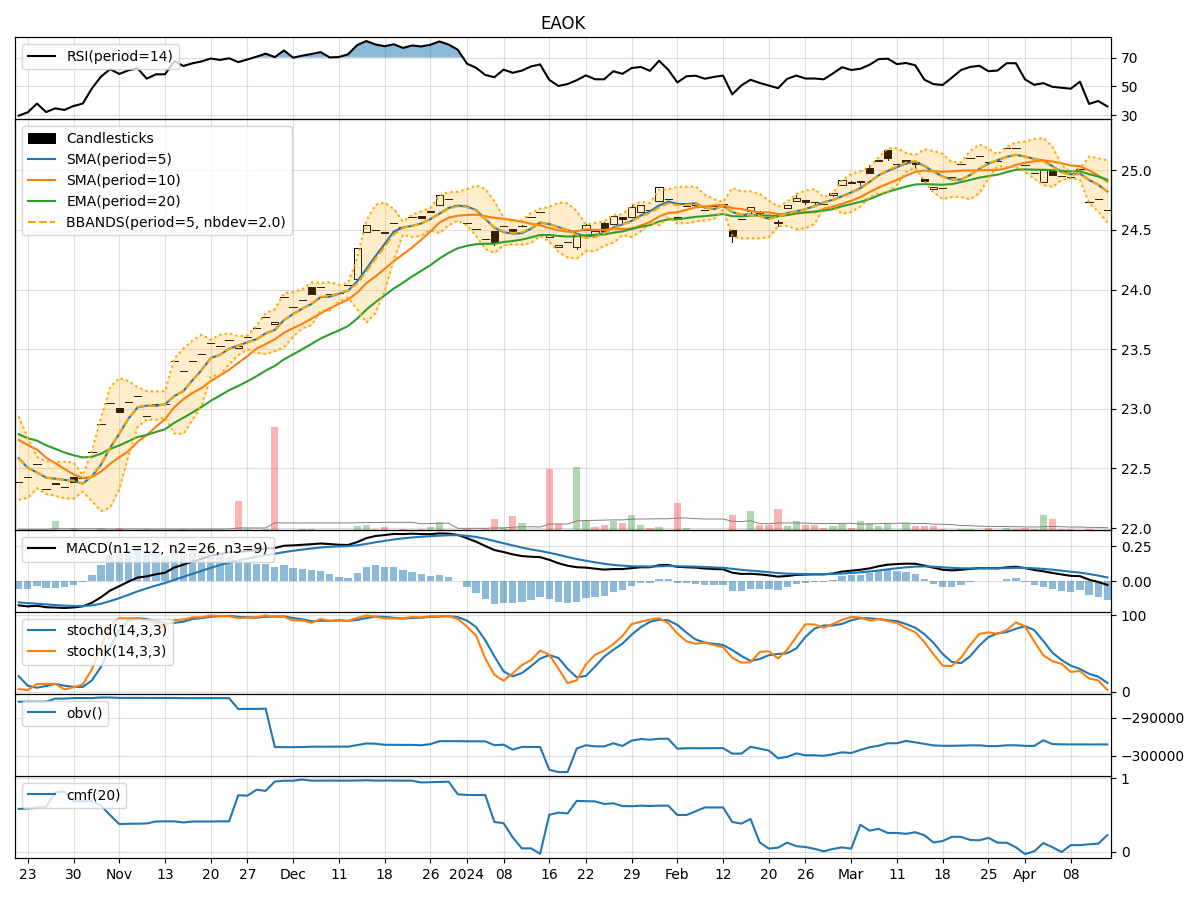
In analyzing the technical indicators for EAOK stock over the last 5 days, we will delve into the trends, momentum, volatility, and volume aspects to provide a comprehensive outlook on the possible future stock price movement. By examining key indicators such as moving averages, MACD, RSI, Bollinger Bands, and OBV, we aim to offer valuable insights and recommendations for potential investors.
Trend Analysis:
- Moving Averages (MA): The 5-day MA has been consistently above the closing prices, indicating a short-term uptrend.
- MACD: The MACD line has been positive and above the signal line, suggesting bullish momentum.
- EMA: The EMA has been trending upwards, supporting the bullish sentiment.
Key Observation: The trend indicators point towards an upward trend in the stock price.
Momentum Analysis:
- RSI: The RSI has been fluctuating around the overbought territory, indicating strong buying momentum.
- Stochastic Oscillator: Both %K and %D have been relatively high, signaling bullish momentum.
- Williams %R: The indicator has been hovering near oversold levels, suggesting potential buying opportunities.
Key Observation: Momentum indicators reflect a bullish sentiment in the stock.
Volatility Analysis:
- Bollinger Bands (BB): The stock price has been trading within the bands, indicating moderate volatility.
- Bollinger Band Width: The band width has been narrowing, suggesting a potential decrease in volatility.
Key Observation: Volatility indicators suggest a sideways movement in the stock price.
Volume Analysis:
- On-Balance Volume (OBV): The OBV has been relatively stable, indicating consistent buying pressure.
- Chaikin Money Flow (CMF): The CMF has been negative, signaling outflows from the stock.
Key Observation: Volume indicators show a neutral stance in the stock.
Conclusion:
Based on the analysis of trend, momentum, volatility, and volume indicators, the overall outlook for EAOK stock in the next few days is bullish with a potential upward price movement. The trend indicators support a continued uptrend, while momentum indicators suggest strong buying momentum. Although volatility is expected to remain stable, the volume indicators indicate a neutral stance. Investors may consider entering long positions or holding onto existing positions with a target price higher than the current levels.
Disclaimer:
This analysis is based solely on technical indicators and historical data, and it is essential to consider other fundamental factors and conduct thorough research before making any investment decisions. Consulting with a financial advisor is recommended to align investment strategies with individual goals and risk tolerance levels.