Technical Analysis of EASG 2024-05-10
Overview:
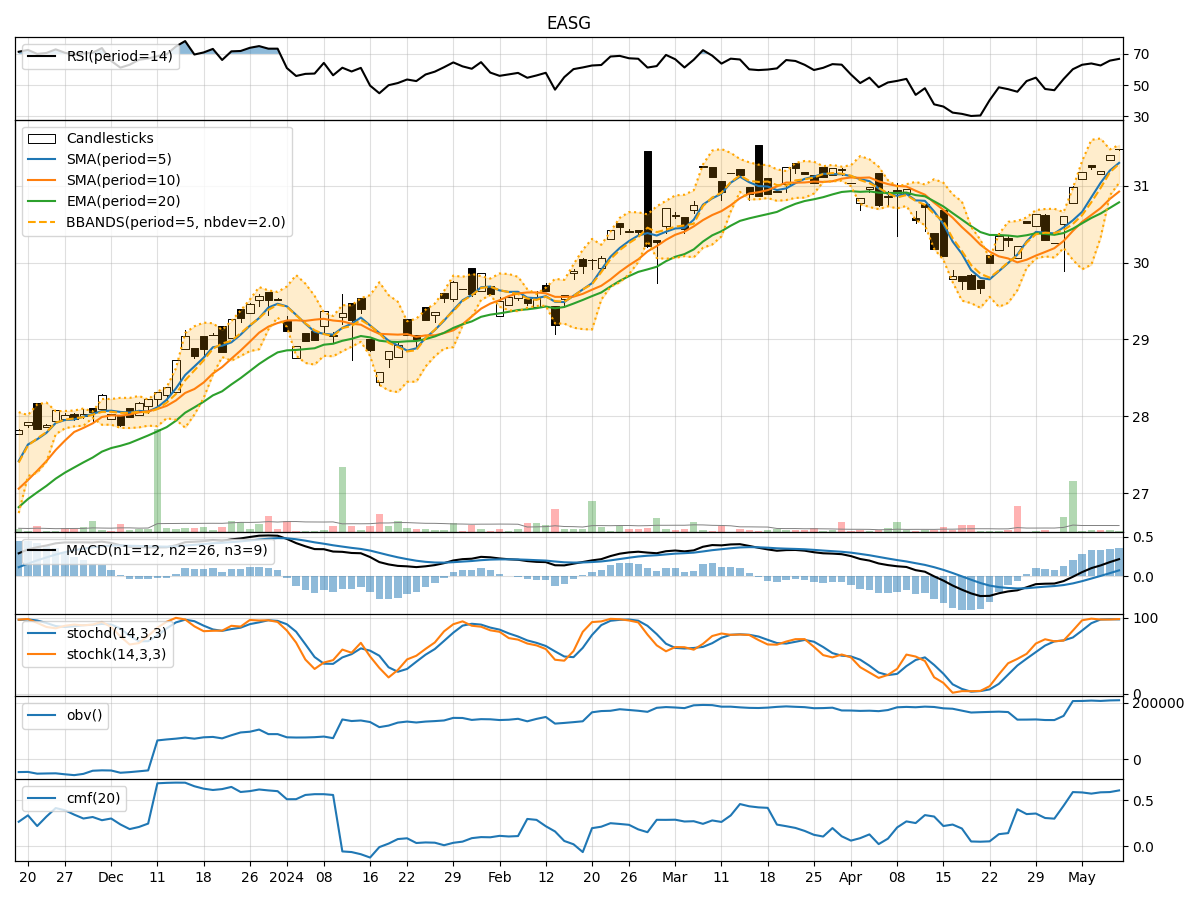
In the last 5 trading days, EASG stock has shown a consistent uptrend in both price and volume. The moving averages have been steadily increasing, indicating a bullish trend. Momentum indicators like RSI and Stochastic oscillators suggest the stock is in overbought territory but still showing strength. Volatility indicators like Bollinger Bands are relatively tight, indicating a potential breakout. Volume indicators show a positive trend in accumulation.
Trend Analysis:
- Moving Averages (MA): The 5-day MA has been consistently above the 10-day SMA, indicating a short-term bullish trend. The EMA(20) is also trending upwards, supporting the bullish sentiment.
- MACD: The MACD line has been above the signal line for the past 5 days, indicating positive momentum. The MACD histogram has been increasing, showing strengthening bullish momentum.
Momentum Analysis:
- RSI: The RSI has been in the overbought zone for the past few days, indicating a strong bullish momentum. However, an overbought condition may lead to a potential pullback.
- Stochastic Oscillator: Both %K and %D lines are in the overbought region, suggesting a strong upward momentum. However, caution is advised as the stock may be due for a correction.
Volatility Analysis:
- Bollinger Bands: The bands have been relatively tight, indicating low volatility. A breakout from this tight range could signal a significant price movement.
- Bollinger %B: The %B indicator is hovering around 0.8, suggesting the stock is trading near the upper band. This could indicate a potential reversal or continuation of the uptrend.
Volume Analysis:
- On-Balance Volume (OBV): The OBV has been steadily increasing over the past 5 days, indicating strong buying pressure and accumulation of the stock.
- Chaikin Money Flow (CMF): The CMF(20) is positive, indicating that money is flowing into the stock over the past 20 days.
Conclusion:
Based on the technical indicators and analysis: - Trend: The stock is in a strong bullish trend supported by moving averages and MACD. - Momentum: The stock shows overbought conditions but still has room for further upside. - Volatility: The tight Bollinger Bands suggest a potential breakout in the near future. - Volume: Accumulation and positive CMF indicate strong buying interest in the stock.
Overall Assessment:
Given the current technical indicators, the next few days are likely to see the stock price continue its upward trajectory. However, caution is advised due to the overbought conditions and the potential for a breakout from the tight Bollinger Bands. Traders should closely monitor the price action for any signs of a reversal or continuation of the bullish trend.