Technical Analysis of EATV 2024-05-10
Overview:
In analyzing the technical indicators for EATV over the last 5 days, we will delve into the trend, momentum, volatility, and volume indicators to provide a comprehensive outlook on the possible stock price movement. By examining these key aspects, we aim to offer valuable insights and predictions for the upcoming days.
Trend Indicators:
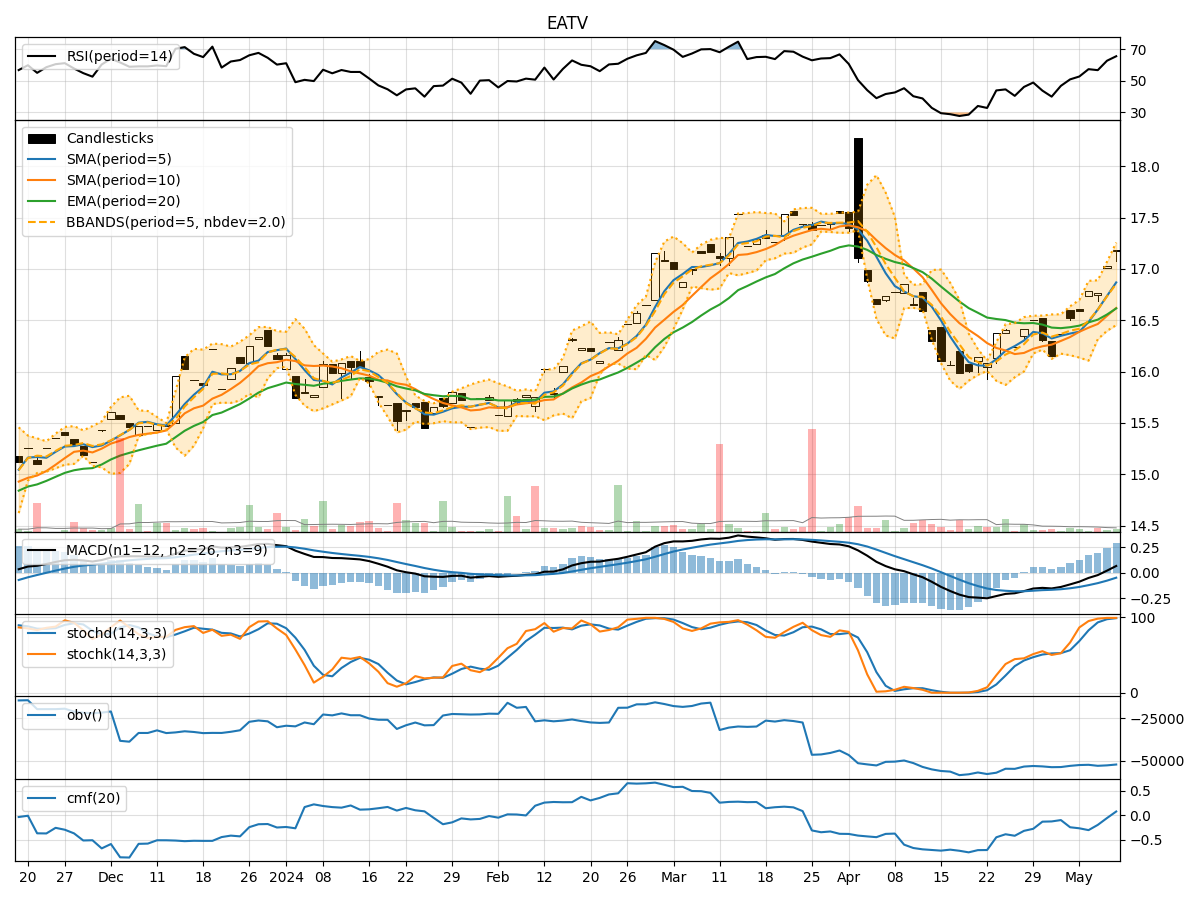
- Moving Averages (MA): The 5-day MA has been consistently above the closing prices, indicating a bullish trend.
- MACD: The MACD line has been positive, showing bullish momentum.
- RSI: The RSI has been in the neutral zone, suggesting a balanced market sentiment.
Momentum Indicators:
- Stochastic Oscillator: Both %K and %D have been in the overbought zone, signaling a potential reversal.
- Williams %R: The indicator has been in the oversold territory, hinting at a possible upward movement.
Volatility Indicators:
- Bollinger Bands: The stock price has been trading within the bands, indicating a period of consolidation.
- BB%: The %B has been fluctuating around the midline, reflecting a lack of clear direction.
Volume Indicators:
- On-Balance Volume (OBV): The OBV has shown a slight decline, suggesting some distribution.
- Chaikin Money Flow (CMF): The CMF has been negative, indicating selling pressure.
Key Observations:
- The trend indicators suggest a bullish bias in the short term.
- Momentum indicators show conflicting signals, with stochastic indicating a potential reversal and Williams %R hinting at a bullish move.
- Volatility indicators point towards a period of consolidation.
- Volume indicators reflect a slight distribution of shares.
Conclusion:
Based on the analysis of the technical indicators, the next few days for EATV could see sideways movement with a slight upward bias. Traders should monitor the stochastic oscillator for a potential reversal and keep an eye on the OBV for any significant shifts in volume. Overall, a cautious approach with a focus on key support and resistance levels is recommended in the current market environment.