Technical Analysis of EATZ 2024-05-10
Overview:
In analyzing the technical indicators for EATZ over the last 5 days, we will delve into the trend, momentum, volatility, and volume indicators to provide a comprehensive outlook on the possible stock price movement. By examining these key factors, we aim to offer valuable insights and predictions for the upcoming days.
Trend Analysis:
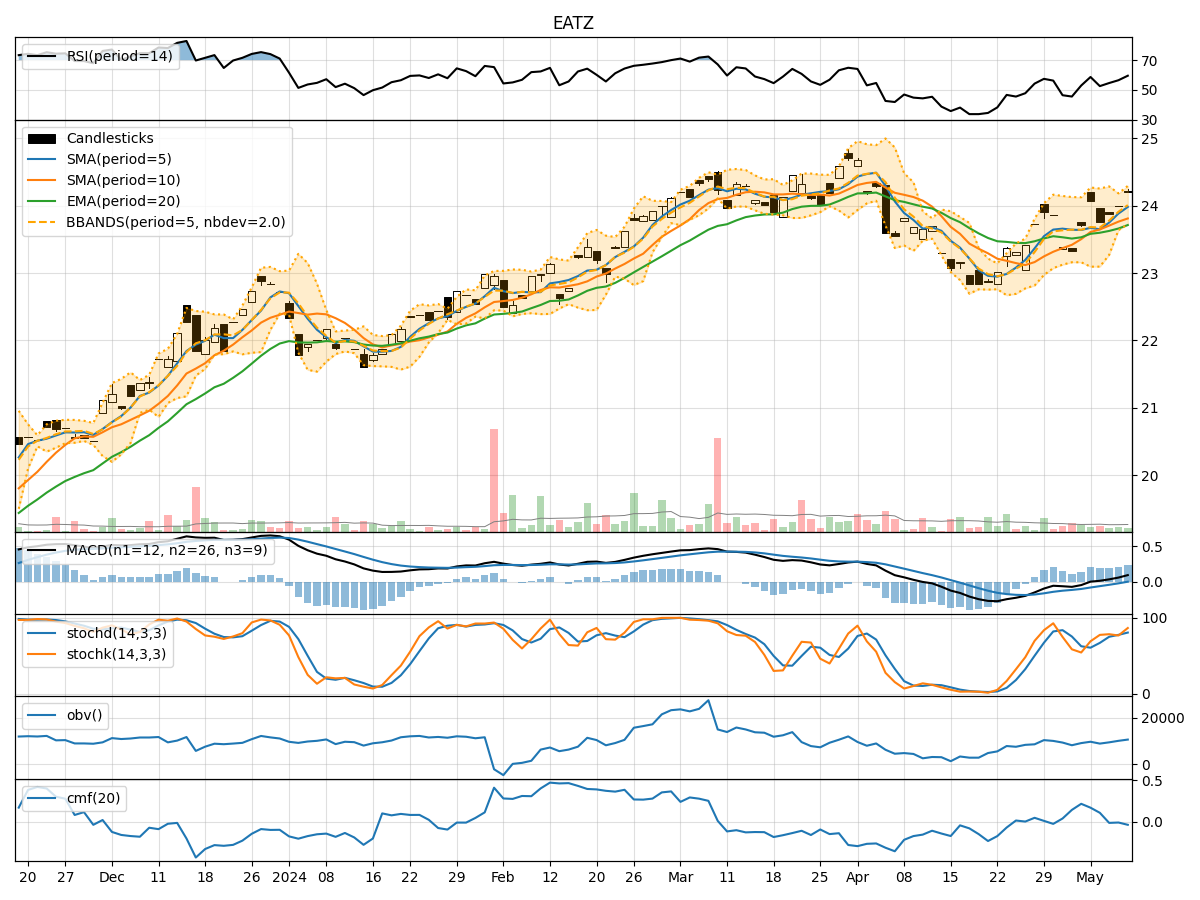
- Moving Averages (MA): The 5-day Moving Average (MA) has been consistently above the Simple Moving Average (SMA) and Exponential Moving Average (EMA), indicating a bullish trend.
- MACD: The MACD line has been above the signal line, with both lines showing an upward trend, suggesting bullish momentum.
- RSI: The Relative Strength Index (RSI) has been fluctuating around the 50 level, indicating a neutral stance in terms of momentum.
Momentum Analysis:
- Stochastic Oscillator: The Stochastic Oscillator has been in the overbought region, suggesting a potential reversal or consolidation in the near future.
- Williams %R: The Williams %R indicator has been hovering around oversold levels, indicating a possible bullish reversal.
Volatility Analysis:
- Bollinger Bands (BB): The stock price has been trading within the Bollinger Bands, with the bands narrowing, indicating a potential decrease in volatility.
- BB %B: The %B indicator has been fluctuating within a narrow range, suggesting a period of consolidation.
Volume Analysis:
- On-Balance Volume (OBV): The OBV indicator has shown mixed signals, with fluctuations in volume accumulation.
- Chaikin Money Flow (CMF): The CMF has been negative, indicating a bearish pressure on the stock.
Key Observations:
- The trend indicators suggest a bullish sentiment, supported by the MACD and moving averages.
- Momentum indicators show conflicting signals, with the Stochastic Oscillator in the overbought region and Williams %R nearing oversold levels.
- Volatility indicators point towards a potential decrease in volatility and a period of consolidation.
- Volume indicators reflect mixed signals, with OBV showing fluctuations and CMF indicating bearish pressure.
Conclusion:
Based on the analysis of the technical indicators, the next few days for EATZ stock price movement could see sideways consolidation with a slight bullish bias. Traders should closely monitor the Stochastic Oscillator for a potential reversal signal and keep an eye on the OBV for any significant volume shifts. Overall, a cautious approach with a focus on risk management is recommended in the current market environment.