Technical Analysis of EBIZ 2024-05-10
Overview:
In analyzing the technical indicators for EBIZ over the last 5 days, we will delve into the trend, momentum, volatility, and volume indicators to provide a comprehensive outlook on the possible stock price movement in the coming days. By examining these key indicators, we aim to offer valuable insights and recommendations for potential investors.
Trend Analysis:
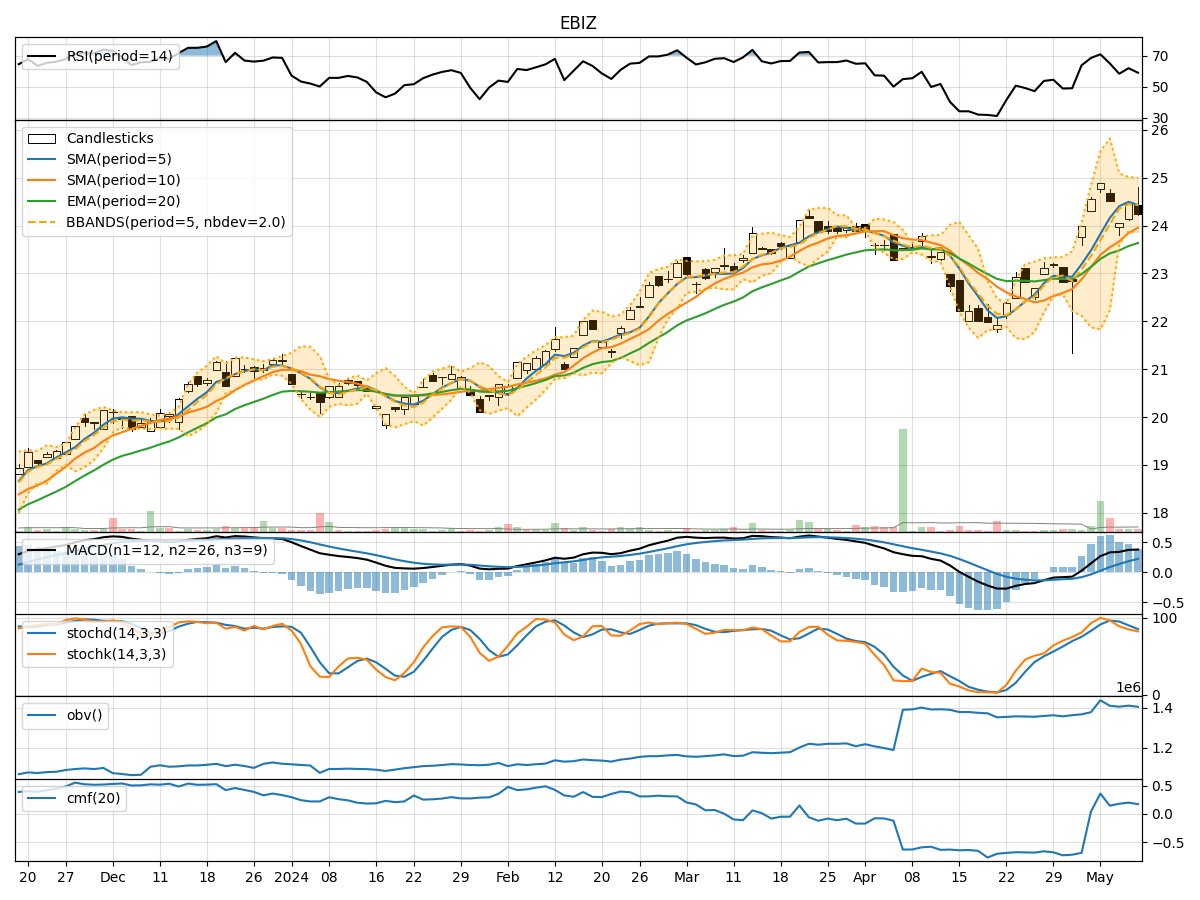
- Moving Averages (MA): The 5-day Moving Average (MA) has been consistently above the Simple Moving Average (SMA) and Exponential Moving Average (EMA), indicating a bullish trend.
- MACD: The MACD line has been above the signal line, with both lines showing an upward trend, suggesting positive momentum in the stock price.
Momentum Analysis:
- RSI: The Relative Strength Index (RSI) has been fluctuating around the 50 level, indicating a neutral momentum in the stock.
- Stochastic Oscillator: The Stochastic Oscillator shows the stock is neither overbought nor oversold, reflecting a balanced momentum.
Volatility Analysis:
- Bollinger Bands (BB): The Bollinger Bands have been narrowing, indicating decreasing volatility in the stock price.
Volume Analysis:
- On-Balance Volume (OBV): The OBV has been relatively stable, suggesting consistent buying and selling pressure.
- Chaikin Money Flow (CMF): The CMF has been positive, indicating a healthy inflow of money into the stock.
Key Observations:
- The trend indicators suggest a bullish sentiment in the stock price.
- Momentum indicators show a neutral stance with no clear direction.
- Volatility has been decreasing, indicating a potential period of consolidation.
- Volume indicators reflect a balanced buying and selling pressure.
Conclusion:
Based on the analysis of the technical indicators, the next few days for EBIZ stock price movement are likely to be sideways with a slight bullish bias. The decreasing volatility and stable volume suggest a period of consolidation, while the bullish trend indicators hint at a potential upward movement. Investors should closely monitor key support and resistance levels for potential entry or exit points.
In summary, while the stock may experience some fluctuations in the short term, the overall outlook remains cautiously optimistic. It is advisable for investors to exercise caution, conduct further research, and consider other fundamental factors before making any investment decisions.