Technical Analysis of EBLU 2024-05-10
Overview:
In analyzing the technical indicators for EBLU over the last 5 days, we will delve into the trend, momentum, volatility, and volume indicators to provide a comprehensive outlook on the possible stock price movement in the coming days.
Trend Analysis:
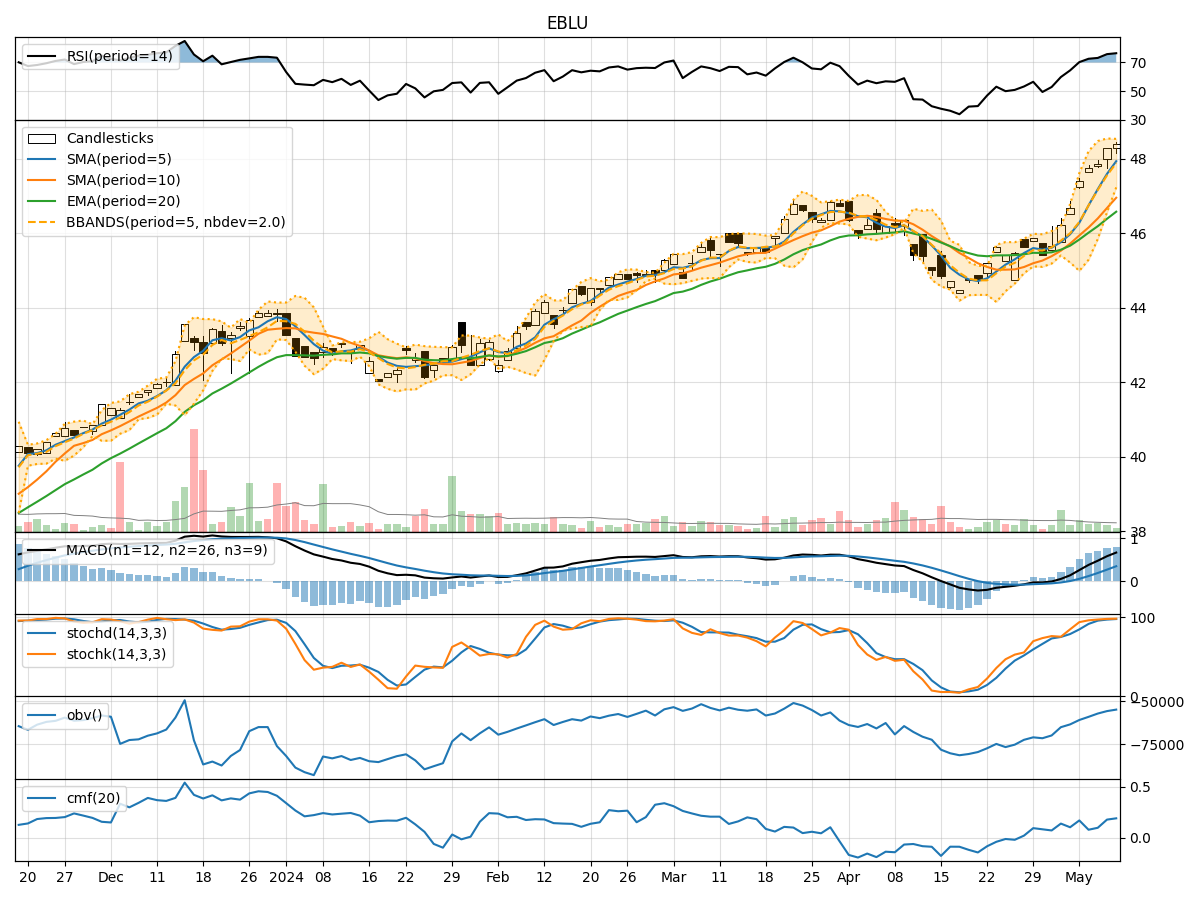
- Moving Averages (MA): The 5-day Moving Average (MA) has been consistently rising, indicating a bullish trend in the short term.
- MACD: The MACD line has been increasing, and the MACD Histogram is also showing positive values, suggesting bullish momentum.
Momentum Analysis:
- RSI: The Relative Strength Index (RSI) has been in the overbought territory, indicating a strong bullish momentum.
- Stochastic Oscillator: Both %K and %D lines of the Stochastic Oscillator are in the overbought zone, signaling a potential reversal or consolidation.
Volatility Analysis:
- Bollinger Bands (BB): The stock price has been trading above the upper Bollinger Band, indicating overbought conditions and a possible pullback.
Volume Analysis:
- On-Balance Volume (OBV): The OBV has been steadily increasing, reflecting strong buying pressure.
- Chaikin Money Flow (CMF): The CMF is positive, indicating that money is flowing into the stock.
Key Observations and Opinions:
- Trend: The trend is bullish in the short term, supported by rising moving averages and positive MACD.
- Momentum: The momentum is strong but showing signs of being overbought, as indicated by the RSI and Stochastic Oscillator.
- Volatility: The stock is currently in an overbought state according to the Bollinger Bands, suggesting a potential reversal or pullback.
- Volume: The increasing OBV and positive CMF indicate strong buying interest in the stock.
Conclusion:
Based on the analysis of the technical indicators, the next few days' possible stock price movement for EBLU is likely to experience a pullback or consolidation. The overbought conditions in the momentum indicators and the stock trading above the upper Bollinger Band suggest a potential reversal in the short term. Traders may consider taking profits or waiting for a better entry point before considering long positions.