Technical Analysis of ECML 2024-05-10
Overview:
In analyzing the technical indicators for ECML stock over the last 5 days, we will delve into the trend, momentum, volatility, and volume indicators to provide a comprehensive assessment of the stock's potential price movement. By examining these key indicators, we aim to offer valuable insights and predictions for the next few days.
Trend Analysis:
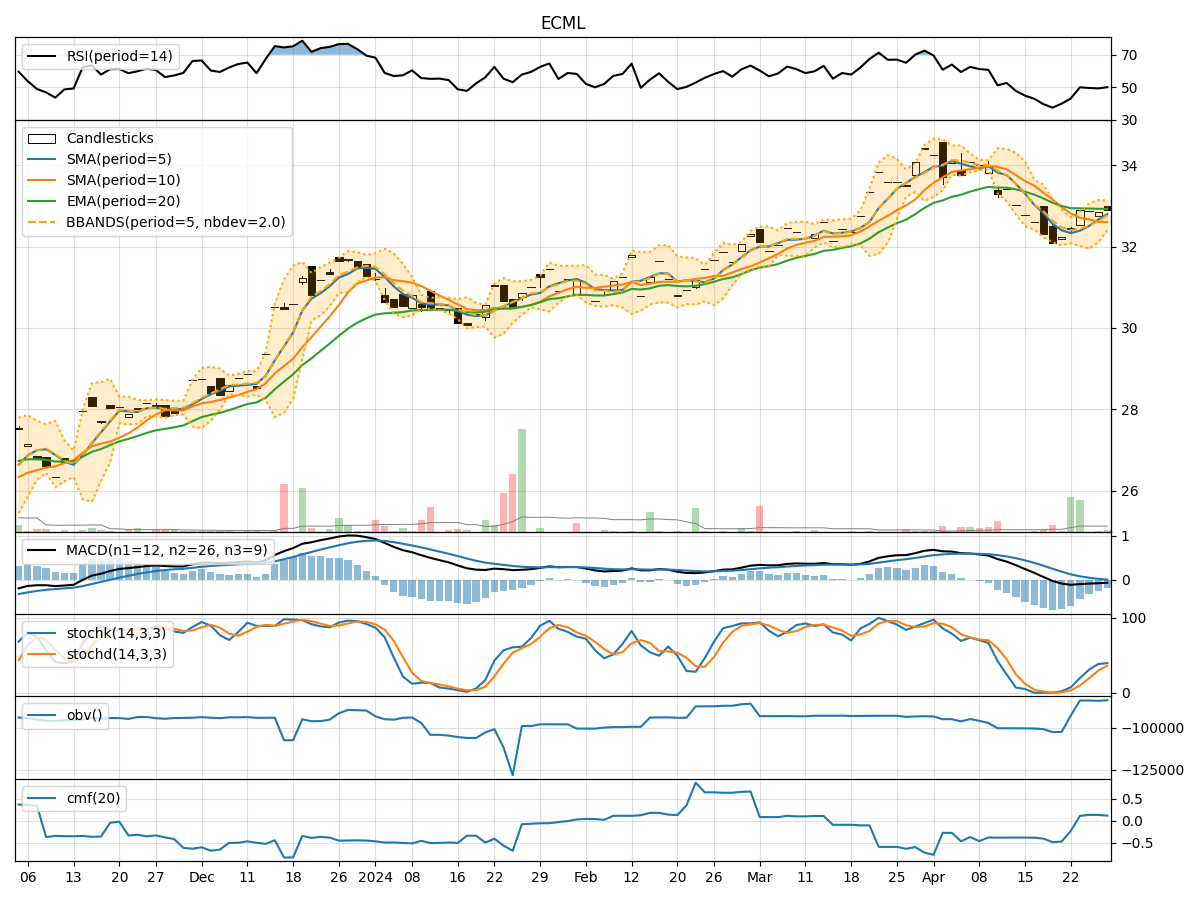
- Moving Averages (MA): The 5-day Moving Average (MA) has been trending above the Simple Moving Average (SMA) and Exponential Moving Average (EMA) over the past 5 days, indicating a short-term bullish trend.
- MACD: The Moving Average Convergence Divergence (MACD) has shown a positive trend with the MACD line consistently above the signal line, suggesting bullish momentum.
- Conclusion: The trend indicators point towards an upward trend in the stock price.
Momentum Analysis:
- RSI: The Relative Strength Index (RSI) has been fluctuating around the 50 level, indicating a neutral momentum in the stock.
- Stochastic Oscillator: Both %K and %D lines of the Stochastic Oscillator have been in the overbought zone, suggesting a potential reversal in momentum.
- Conclusion: The momentum indicators suggest a neutral to slightly bearish outlook for the stock.
Volatility Analysis:
- Bollinger Bands: The Bollinger Bands have shown a narrowing of the bands, indicating decreasing volatility in the stock price.
- Conclusion: The volatility indicators suggest a consolidation phase in the stock price.
Volume Analysis:
- On-Balance Volume (OBV): The OBV has been relatively stable over the past 5 days, indicating a balance between buying and selling pressure.
- Chaikin Money Flow (CMF): The CMF has been slightly positive, suggesting some accumulation in the stock.
- Conclusion: The volume indicators point towards a neutral sentiment in the stock.
Conclusion:
Based on the analysis of the technical indicators, the stock is likely to experience sideways movement in the next few days. The trend indicators signal an upward trend, while the momentum indicators suggest a neutral to slightly bearish momentum. The volatility indicators indicate a consolidation phase, and the volume indicators show a neutral sentiment. Therefore, it is recommended to closely monitor the stock for any potential breakout or reversal signals before making any trading decisions.