Technical Analysis of ECNS 2024-05-10
Overview:
In analyzing the technical indicators for ECNS stock over the last 5 days, we will delve into the trend, momentum, volatility, and volume indicators to provide a comprehensive outlook on the possible future stock price movement. By examining these key indicators, we aim to offer valuable insights and predictions for the upcoming trading days.
Trend Analysis:
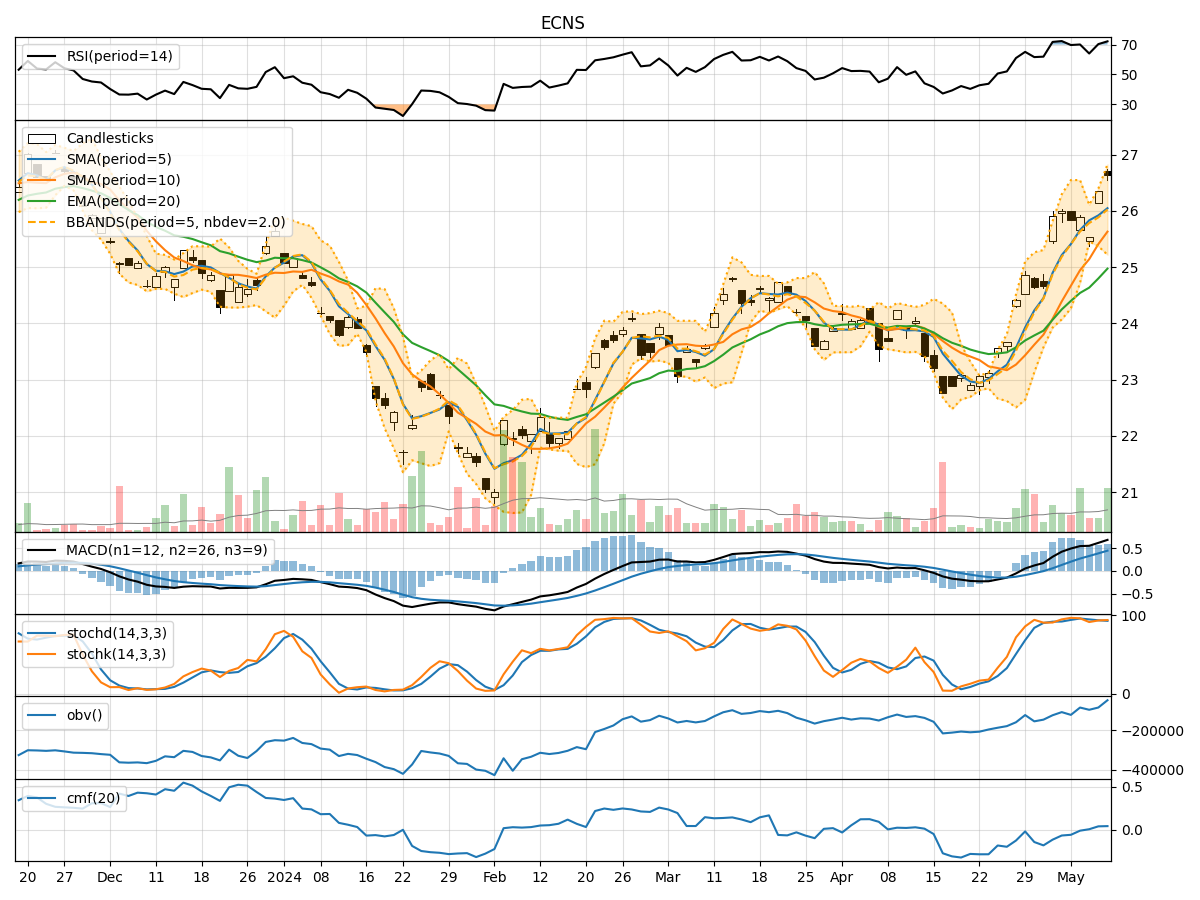
- Moving Averages (MA): The 5-day Moving Average (MA) has been consistently above the 10-day Simple Moving Average (SMA), indicating a short-term bullish trend.
- Exponential Moving Average (EMA): The EMA has been steadily increasing, reflecting positive price momentum.
- MACD: The MACD line has been above the signal line, suggesting bullish momentum in the stock price.
Key Observation: The trend indicators point towards an upward trend in the stock price.
Momentum Analysis:
- Relative Strength Index (RSI): RSI values have been consistently above 70, indicating overbought conditions but also strong bullish momentum.
- Stochastic Oscillator: Both %K and %D values have been relatively high, signaling strong buying pressure.
- Williams %R (Willams %R): The Williams %R has been consistently in the oversold territory, indicating a strong bullish sentiment.
Key Observation: Momentum indicators suggest a bullish sentiment in the stock.
Volatility Analysis:
- Bollinger Bands (BB): The stock price has been trading close to the upper Bollinger Band, indicating high volatility and potential overbought conditions.
- Bollinger Band Width (BBW): The BBW has been widening, suggesting increased price volatility.
- Bollinger Band %B (BBP): The %B value has been above 0.5, indicating a bullish trend.
Key Observation: Volatility indicators suggest increased volatility in the stock price.
Volume Analysis:
- On-Balance Volume (OBV): The OBV has been steadily increasing, indicating strong buying volume.
- Chaikin Money Flow (CMF): The CMF has been positive, reflecting buying pressure in the stock.
Key Observation: Volume indicators point towards positive buying pressure in the stock.
Conclusion:
Based on the analysis of trend, momentum, volatility, and volume indicators, the overall outlook for ECNS stock is bullish. The stock is likely to experience further upward movement in the coming days, supported by strong buying pressure, positive momentum, and increasing volume. Traders and investors may consider buying opportunities in ECNS stock for potential short to medium-term gains.
Disclaimer:
This analysis is based solely on technical indicators and historical data, and it is important to consider other fundamental factors and market dynamics before making investment decisions. It is recommended to conduct thorough research and consult with a financial advisor before making any trading or investment choices.