Technical Analysis of ECON 2024-05-10
Overview:
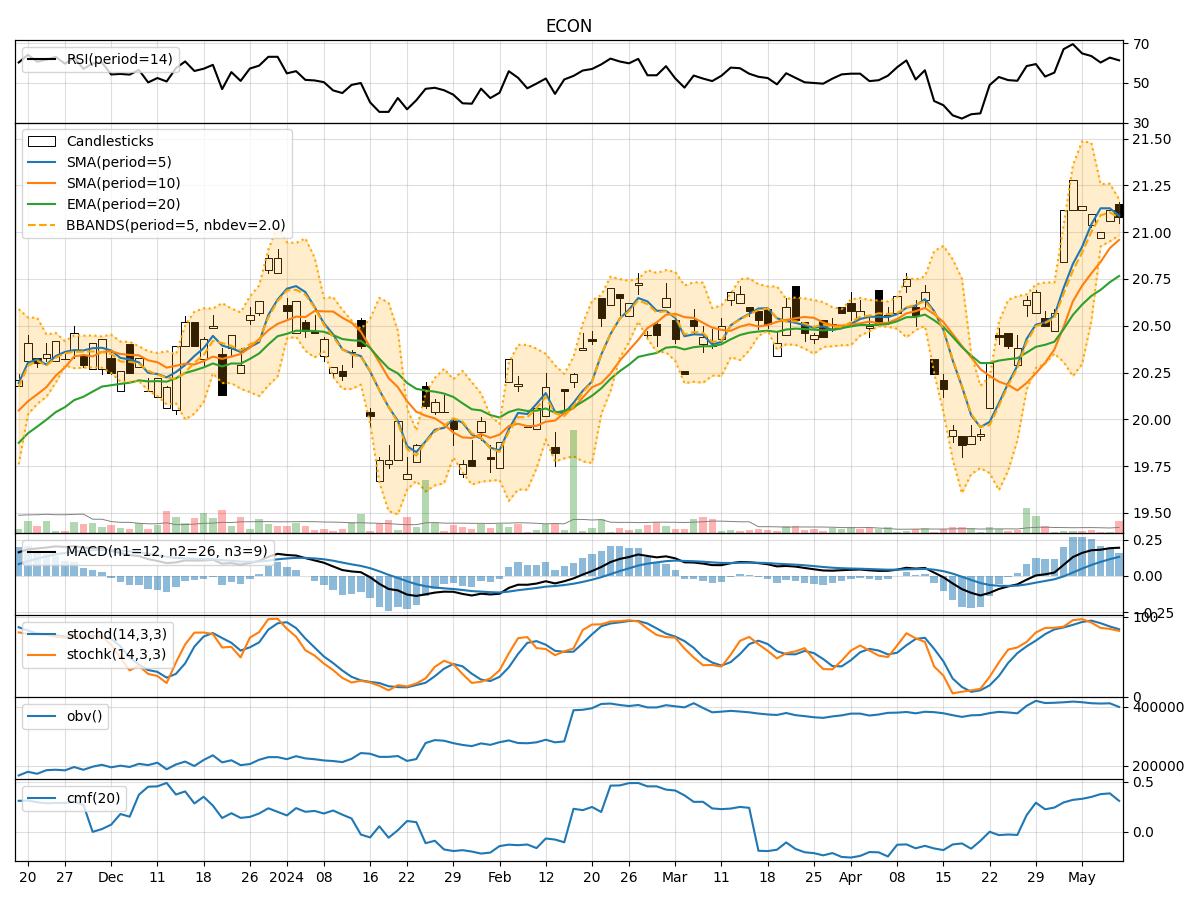
In analyzing the technical indicators for ECON stock over the last 5 days, we will delve into the trend, momentum, volatility, and volume indicators to provide a comprehensive outlook on the possible stock price movement in the coming days. By examining key metrics such as moving averages, MACD, RSI, Bollinger Bands, and OBV, we aim to offer valuable insights and recommendations for potential trading strategies.
Trend Indicators:
- Moving Averages (MA): The 5-day MA has been trending above the closing prices, indicating a short-term uptrend.
- MACD: The MACD line has been consistently above the signal line, suggesting bullish momentum.
- EMA: The EMA has been steadily increasing, reflecting a positive trend.
- Key Observation: The stock is exhibiting a bullish trend based on the moving averages and MACD.
Momentum Indicators:
- RSI: The RSI has been fluctuating around the 60-65 range, indicating moderate momentum.
- Stochastic Oscillator: Both %K and %D have been gradually decreasing but remain in the overbought territory.
- Williams %R: The stock has been oversold according to the Williams %R indicator.
- Key Observation: Momentum is showing signs of weakening but still remains in bullish territory.
Volatility Indicators:
- Bollinger Bands (BB): The stock price has been trading within the bands, suggesting stable volatility.
- Bollinger Band Width: The band width has been narrowing, indicating a potential decrease in volatility.
- Key Observation: Volatility is relatively low, and the stock is consolidating within the Bollinger Bands.
Volume Indicators:
- On-Balance Volume (OBV): The OBV has been fluctuating but generally trending upwards, indicating buying pressure.
- Chaikin Money Flow (CMF): The CMF has been positive, reflecting accumulation.
- Key Observation: Volume indicators suggest a positive sentiment with increasing buying interest.
Conclusion:
Based on the analysis of the technical indicators, the next few days' possible stock price movement for ECON is likely to be sideways with a slight bullish bias. The stock is currently in a consolidation phase with stable volatility and moderate momentum. While the trend remains bullish based on moving averages and MACD, the weakening momentum indicators and overbought conditions suggest a potential pause in the upward movement. Traders may consider monitoring key support and resistance levels for potential entry and exit points.