Technical Analysis of ECOW 2024-05-10
Overview:
In analyzing the technical indicators for ECOW stock over the last 5 days, we will delve into the trend, momentum, volatility, and volume indicators to provide a comprehensive outlook on the possible stock price movement in the coming days. By examining key metrics such as moving averages, MACD, RSI, Bollinger Bands, and OBV, we aim to offer valuable insights and predictions for potential investors.
Trend Indicators:
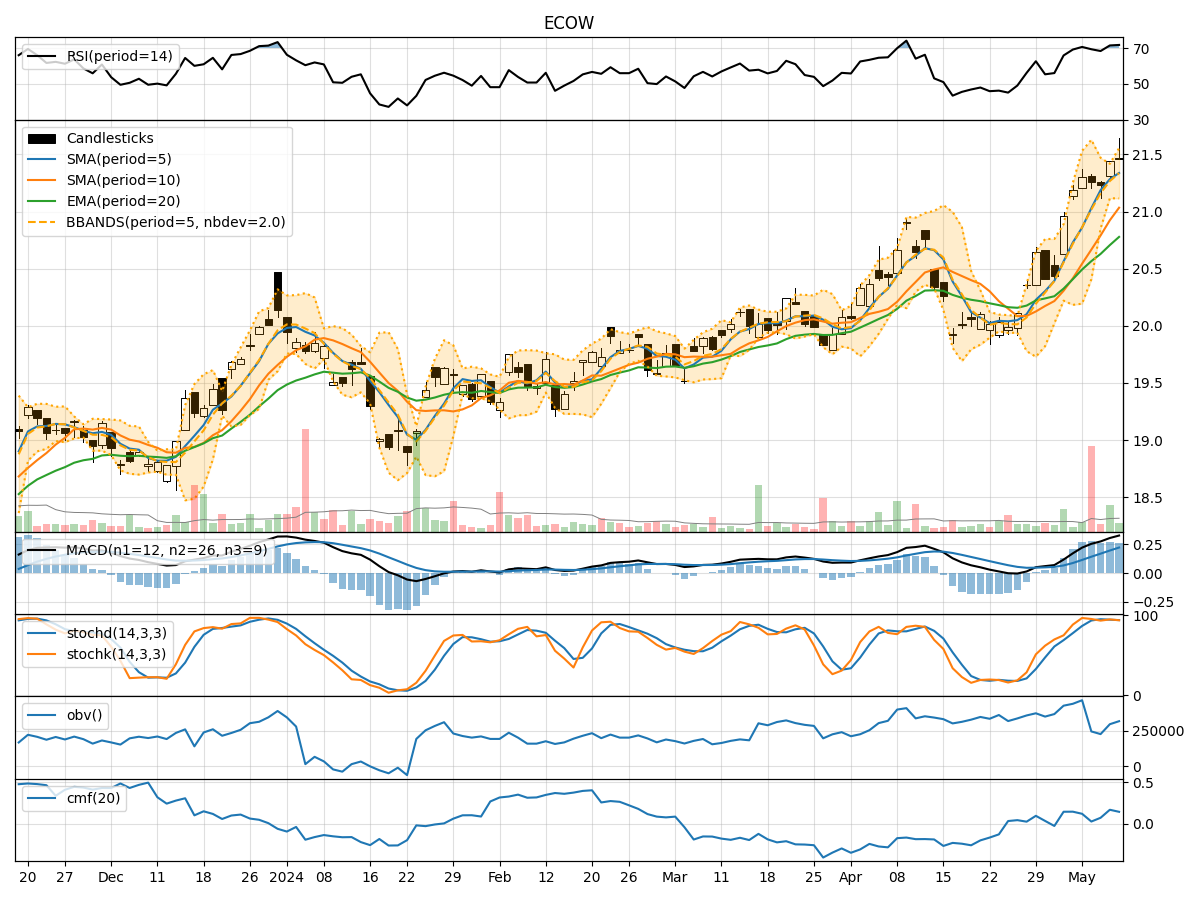
- Moving Averages (MA): The 5-day MA has been consistently above the closing price, indicating a bullish trend.
- MACD: The MACD line has been above the signal line, suggesting a positive momentum in the stock price.
- EMA: The EMA has been steadily increasing, reflecting a bullish sentiment in the market.
Momentum Indicators:
- RSI: The RSI has been in the overbought territory, signaling a strong bullish momentum.
- Stochastic Oscillator: Both %K and %D have been relatively high, indicating an overbought condition.
- Williams %R: The indicator has been in the oversold region, suggesting a potential reversal in the stock price.
Volatility Indicators:
- Bollinger Bands: The stock price has been trading within the bands, indicating a period of consolidation.
- Bollinger %B: The %B value has been fluctuating around 0.5, suggesting a balanced market sentiment.
Volume Indicators:
- On-Balance Volume (OBV): The OBV has shown a mixed trend, with some days experiencing positive volume accumulation.
- Chaikin Money Flow (CMF): The CMF has been positive, indicating buying pressure in the market.
Key Observations:
- The stock is currently in a strong bullish trend based on moving averages and MACD.
- Momentum indicators suggest an overbought condition, which could lead to a potential pullback.
- Volatility indicators point towards a period of consolidation with no clear directional bias.
- Volume indicators show mixed signals, with some days indicating buying interest.
Conclusion:
Based on the analysis of the technical indicators, the next few days for ECOW stock could see a potential consolidation phase with a slight upward bias. Traders should be cautious of the overbought conditions highlighted by momentum indicators and monitor for any signs of a reversal. It is advisable to wait for clearer signals before making significant trading decisions.