Technical Analysis of EDEN 2024-05-10
Overview:
In analyzing the technical indicators for EDEN stock over the last 5 days, we will delve into the trend, momentum, volatility, and volume indicators to provide a comprehensive outlook on the possible future stock price movement. By examining these key indicators, we aim to offer valuable insights and predictions for the upcoming trading days.
Trend Analysis:
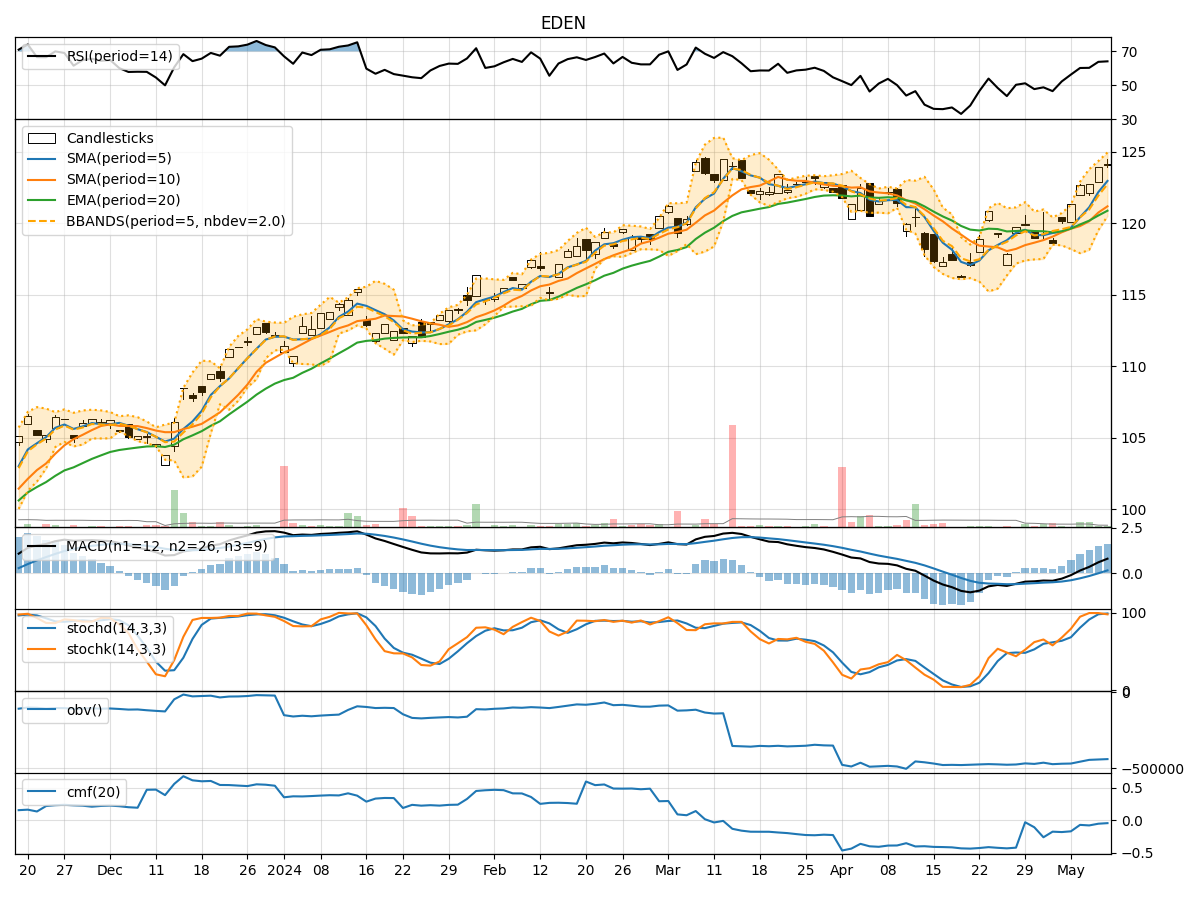
- Moving Averages (MA): The 5-day Moving Average (MA) has been consistently trending upwards, indicating a positive momentum in the stock price.
- MACD: The Moving Average Convergence Divergence (MACD) has shown an increasing trend, with the MACD line crossing above the signal line, suggesting a bullish signal.
- EMA: The Exponential Moving Average (EMA) has been steadily rising, reflecting a bullish sentiment in the stock.
Momentum Analysis:
- RSI: The Relative Strength Index (RSI) has been in the overbought territory, indicating a strong bullish momentum in the stock.
- Stochastic Oscillator: Both %K and %D have been in the overbought zone, suggesting a potential reversal or consolidation in the stock price.
- Williams %R: The Williams %R is in the oversold region, signaling a potential buying opportunity.
Volatility Analysis:
- Bollinger Bands: The Bollinger Bands have been narrowing, indicating decreasing volatility in the stock price.
- Bollinger %B: The %B indicator is below 1, suggesting that the stock price is trading below the upper Bollinger Band, potentially indicating a pullback or consolidation.
Volume Analysis:
- On-Balance Volume (OBV): The OBV has been declining, indicating a decrease in buying pressure and potential profit-taking by investors.
- Chaikin Money Flow (CMF): The CMF has been negative, suggesting a lack of buying interest in the stock.
Conclusion:
Based on the analysis of the technical indicators, the next few days' possible stock price movement for EDEN is likely to experience consolidation or a minor pullback. The stock has shown signs of being overbought based on the RSI and Stochastic Oscillator readings, indicating a potential reversal or sideways movement. The narrowing Bollinger Bands and declining OBV further support the view of a temporary pause in the upward momentum. Traders may consider taking profits or waiting for a better entry point before considering new positions.