Technical Analysis of EDIV 2024-05-10
Overview:
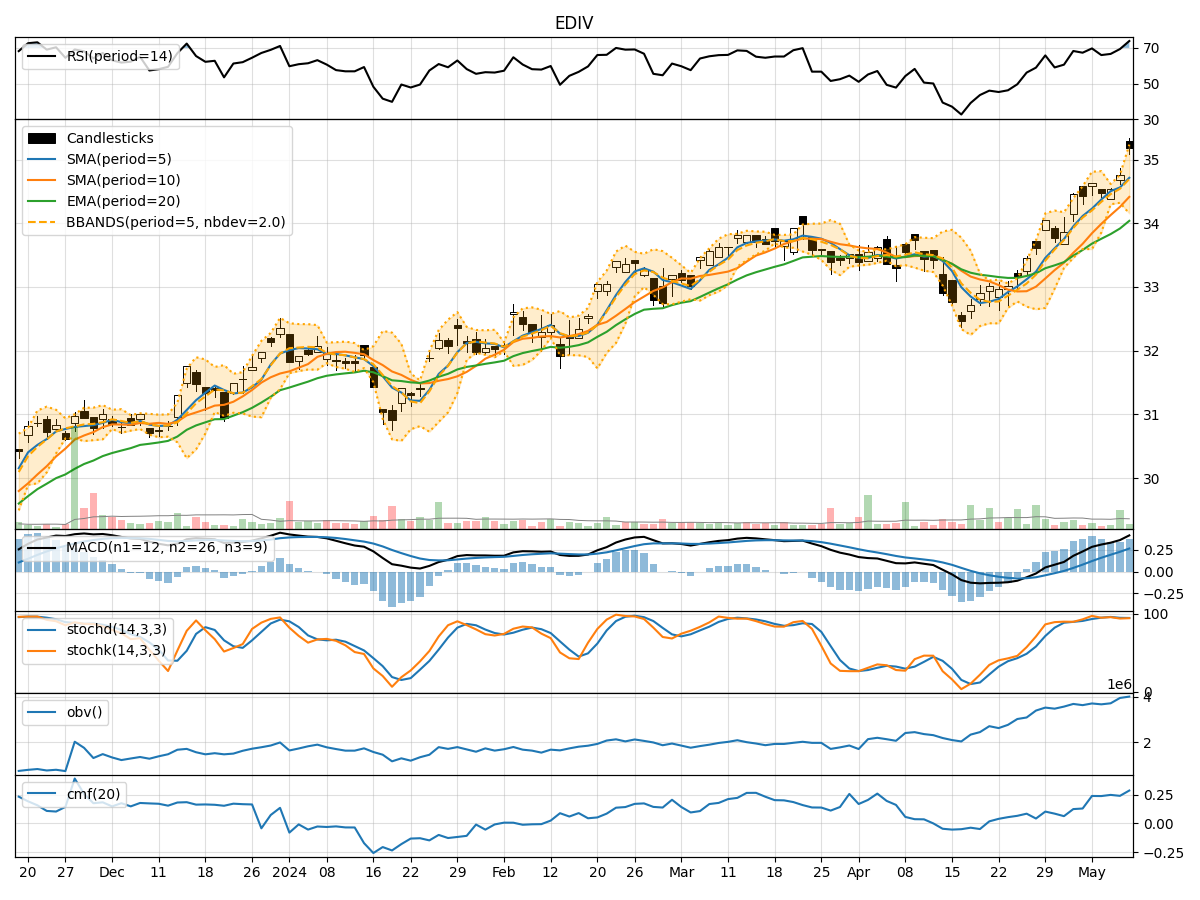
In analyzing the technical indicators for EDIV over the last 5 days, we will delve into the trend, momentum, volatility, and volume indicators to provide a comprehensive outlook on the possible stock price movement in the coming days. By examining these key indicators, we aim to offer valuable insights and recommendations for potential investors.
Trend Analysis:
- Moving Averages (MA): The 5-day Moving Average (MA) has been consistently above the Simple Moving Average (SMA) and Exponential Moving Average (EMA), indicating a bullish trend.
- MACD: The MACD line has been above the signal line, with both lines showing an upward trend, suggesting bullish momentum.
- RSI: The Relative Strength Index (RSI) has been in the overbought territory, indicating a strong bullish momentum.
Momentum Analysis:
- Stochastic Oscillator: Both %K and %D lines of the Stochastic Oscillator have been in the overbought zone, suggesting a potential reversal or consolidation.
- Williams %R: The Williams %R has been consistently in the oversold territory, indicating a strong bullish sentiment.
Volatility Analysis:
- Bollinger Bands (BB): The stock price has been trading within the upper Bollinger Band (BBU), indicating an overbought condition.
- BB% (Bollinger Band %B): The BB% has been above 0.8, suggesting a high volatility period.
Volume Analysis:
- On-Balance Volume (OBV): The OBV has shown a positive trend, indicating accumulation by investors.
- Chaikin Money Flow (CMF): The CMF has been positive, reflecting buying pressure in the stock.
Key Observations:
- The trend indicators suggest a strong bullish sentiment in the stock.
- Momentum indicators indicate a potential reversal or consolidation in the near term.
- Volatility indicators point towards high volatility in the stock price.
- Volume indicators show positive accumulation and buying pressure.
Conclusion:
Based on the analysis of the technical indicators, the next few days' possible stock price movement for EDIV is likely to be sideways to slightly bearish in the short term. While the trend remains bullish, the overbought conditions in momentum indicators and high volatility levels suggest a possible correction or consolidation phase. Investors should closely monitor the price action and key support levels for potential entry or exit points.
Recommendation:
- Short-term Traders: Consider taking profits or setting tight stop-loss orders to protect gains.
- Long-term Investors: Hold positions but remain vigilant for potential pullbacks to add to positions at lower levels.
- Risk Management: Implement proper risk management strategies to mitigate potential downside risks in a volatile market environment.
By combining technical analysis with risk management practices, investors can make informed decisions and navigate market uncertainties effectively.