Technical Analysis of EDOG 2024-05-10
Overview:
In analyzing the technical indicators for EDOG stock over the last 5 days, we will delve into the trend, momentum, volatility, and volume indicators to provide a comprehensive outlook on the possible stock price movement in the coming days. By examining these key indicators, we aim to offer valuable insights and predictions to guide investment decisions.
Trend Analysis:
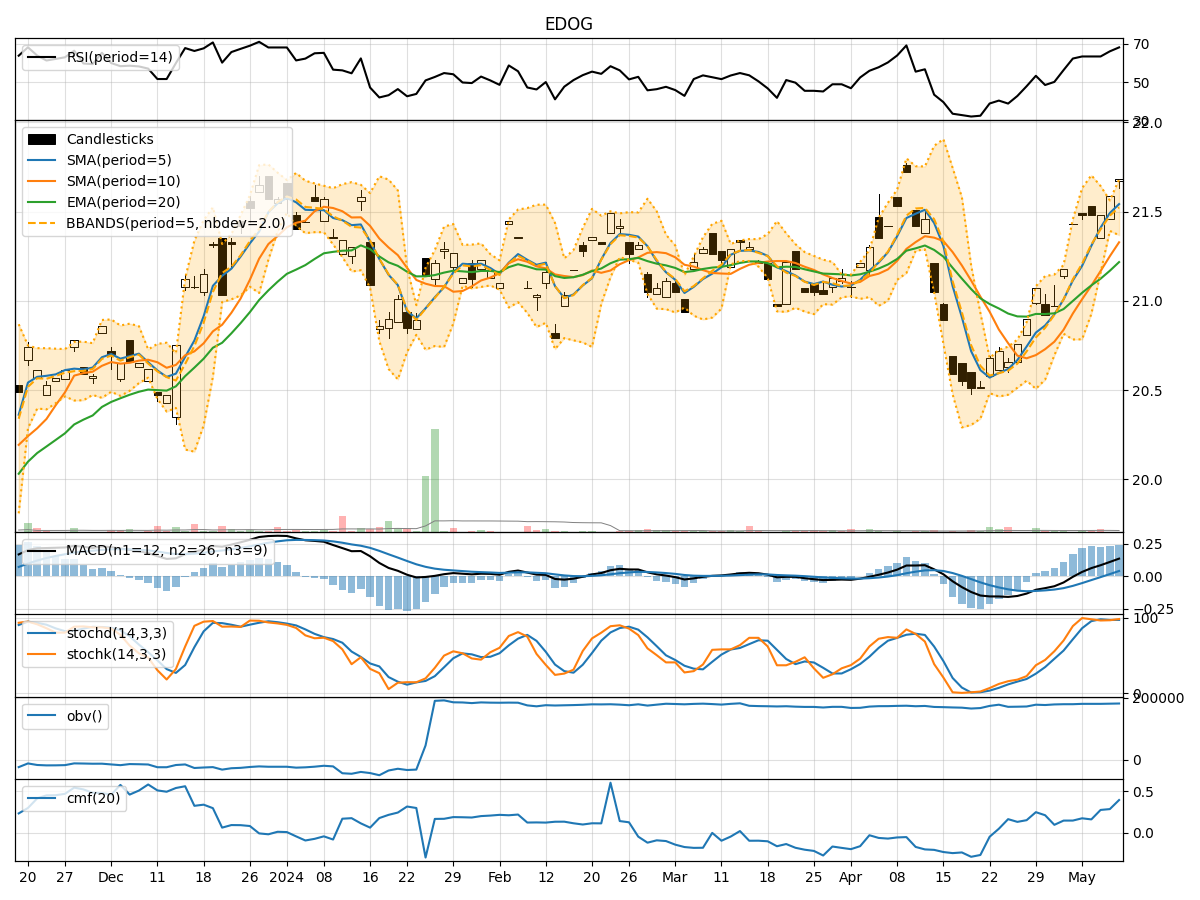
- Moving Averages (MA): The 5-day Moving Average (MA) has been consistently above the Simple Moving Average (SMA) and Exponential Moving Average (EMA), indicating a bullish trend.
- MACD: The MACD line has been consistently above the signal line, with both lines showing an upward trend, suggesting bullish momentum.
- RSI: The Relative Strength Index (RSI) has been in the overbought territory, indicating a strong bullish momentum.
Momentum Analysis:
- Stochastic Oscillator: Both %K and %D lines of the Stochastic Oscillator have been in the overbought zone, suggesting a potential reversal or consolidation.
- Williams %R: The Williams %R indicator has been consistently in the oversold territory, indicating a strong bullish sentiment.
Volatility Analysis:
- Bollinger Bands (BB): The stock price has been trading within the upper Bollinger Band (BBU), indicating high volatility and a potential overbought condition.
- BB% (BB Percentage): The BB% has been above 0.8, suggesting a high volatility environment.
Volume Analysis:
- On-Balance Volume (OBV): The OBV indicator has shown a consistent increase over the last 5 days, indicating strong buying pressure.
- Chaikin Money Flow (CMF): The CMF has been positive and increasing, reflecting a bullish sentiment in the stock.
Key Observations:
- The trend indicators suggest a strong bullish momentum in the stock.
- Momentum indicators show signs of potential overbought conditions and a need for caution.
- Volatility indicators point towards high volatility and a possible correction.
- Volume indicators indicate strong buying pressure and positive market sentiment.
Conclusion:
Based on the analysis of the technical indicators, the next few days' possible stock price movement for EDOG is likely to be upward in the short term due to the strong bullish trend and positive volume indicators. However, caution is advised as momentum indicators signal potential overbought conditions, and volatility indicators suggest a correction may be on the horizon. Traders should closely monitor the price action and consider taking profits or implementing risk management strategies to navigate the market dynamics effectively.