Technical Analysis of EDOW 2024-05-10
Overview:
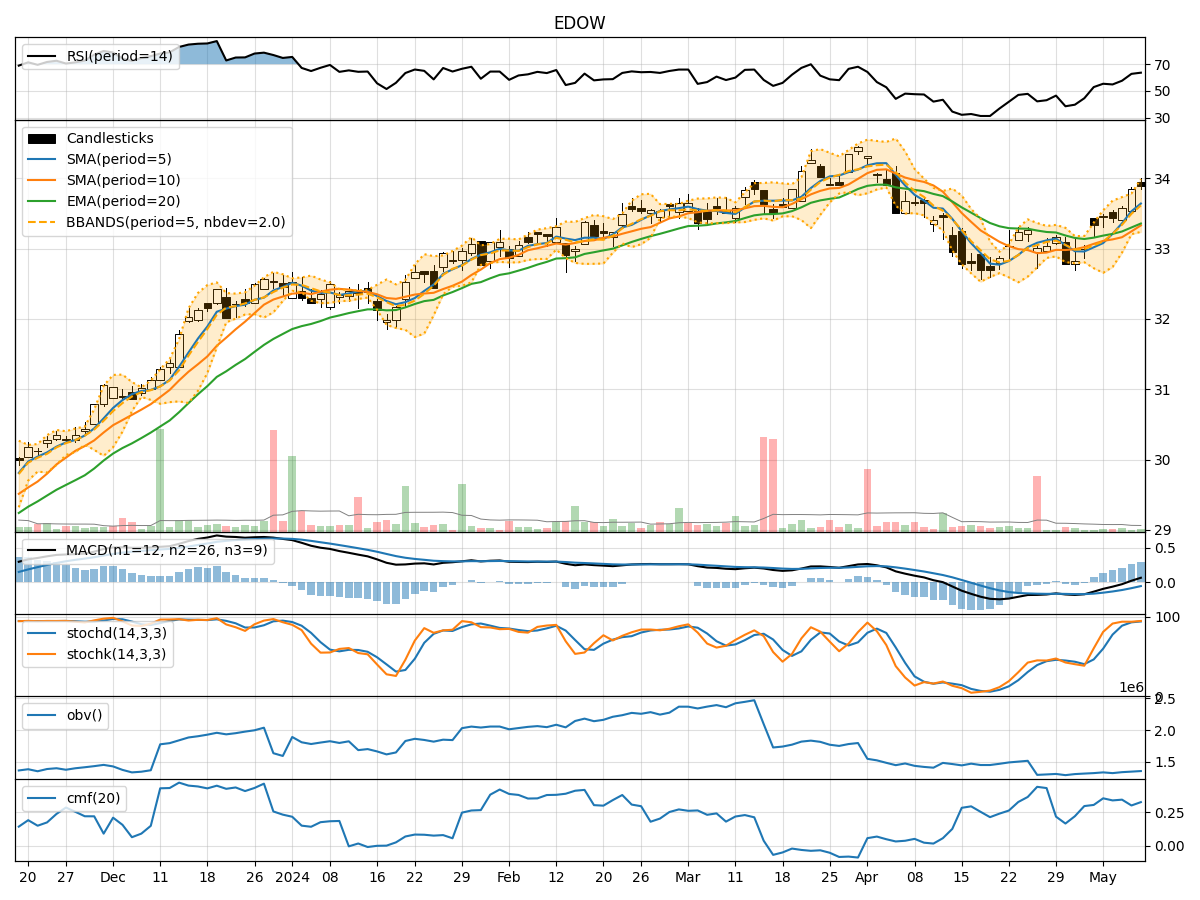
In analyzing the technical indicators for EDOW over the last 5 days, we will delve into the trend, momentum, volatility, and volume indicators to provide a comprehensive outlook on the possible stock price movement in the coming days.
Trend Analysis:
- Moving Averages (MA): The 5-day Moving Average (MA) has been trending upwards, indicating a positive short-term momentum.
- MACD: The MACD line has been consistently above the signal line, suggesting a bullish trend.
- Relative to Moving Averages: The stock price has been consistently above the 10-day Simple Moving Average (SMA), further supporting a bullish sentiment.
Momentum Analysis:
- RSI: The Relative Strength Index (RSI) has been in the overbought territory, indicating a strong bullish momentum.
- Stochastic Oscillator: Both %K and %D have been in the overbought zone, signaling a potential reversal or consolidation.
- Williams %R: The Williams %R is also in the oversold region, suggesting a possible pullback.
Volatility Analysis:
- Bollinger Bands (BB): The stock price has been trading within the upper Bollinger Band, indicating an overbought condition.
- Bollinger Band Width: The Band Width has been narrowing, suggesting a potential decrease in volatility.
- Bollinger Band %B: The %B indicator is above 0.8, indicating a high price relative to the bands.
Volume Analysis:
- On-Balance Volume (OBV): The OBV has been showing a slight decrease, indicating some distribution.
- Chaikin Money Flow (CMF): The CMF has been positive, suggesting buying pressure in the stock.
Key Observations:
- The trend indicators suggest a bullish sentiment in the short term.
- Momentum indicators show an overbought condition, indicating a potential reversal or consolidation.
- Volatility indicators point towards a decrease in volatility and a possible price consolidation.
- Volume indicators indicate a slight distribution but overall positive buying pressure.
Conclusion:
Based on the analysis of the technical indicators, the next few days for EDOW could see a potential consolidation or pullback in the stock price. The overbought conditions in the momentum indicators and the narrowing Bollinger Bands suggest a possible period of price stabilization. Traders may consider taking profits or waiting for a better entry point before considering new positions. It is essential to monitor the price action closely for any signs of a reversal or continuation of the current trend.