Technical Analysis of EELV 2024-05-10
Overview:
In analyzing the technical indicators for EELV over the last 5 days, we will delve into the trend, momentum, volatility, and volume indicators to provide a comprehensive outlook on the possible stock price movement in the coming days. By examining these key indicators, we aim to offer valuable insights and predictions to guide your investment decisions.
Trend Analysis:
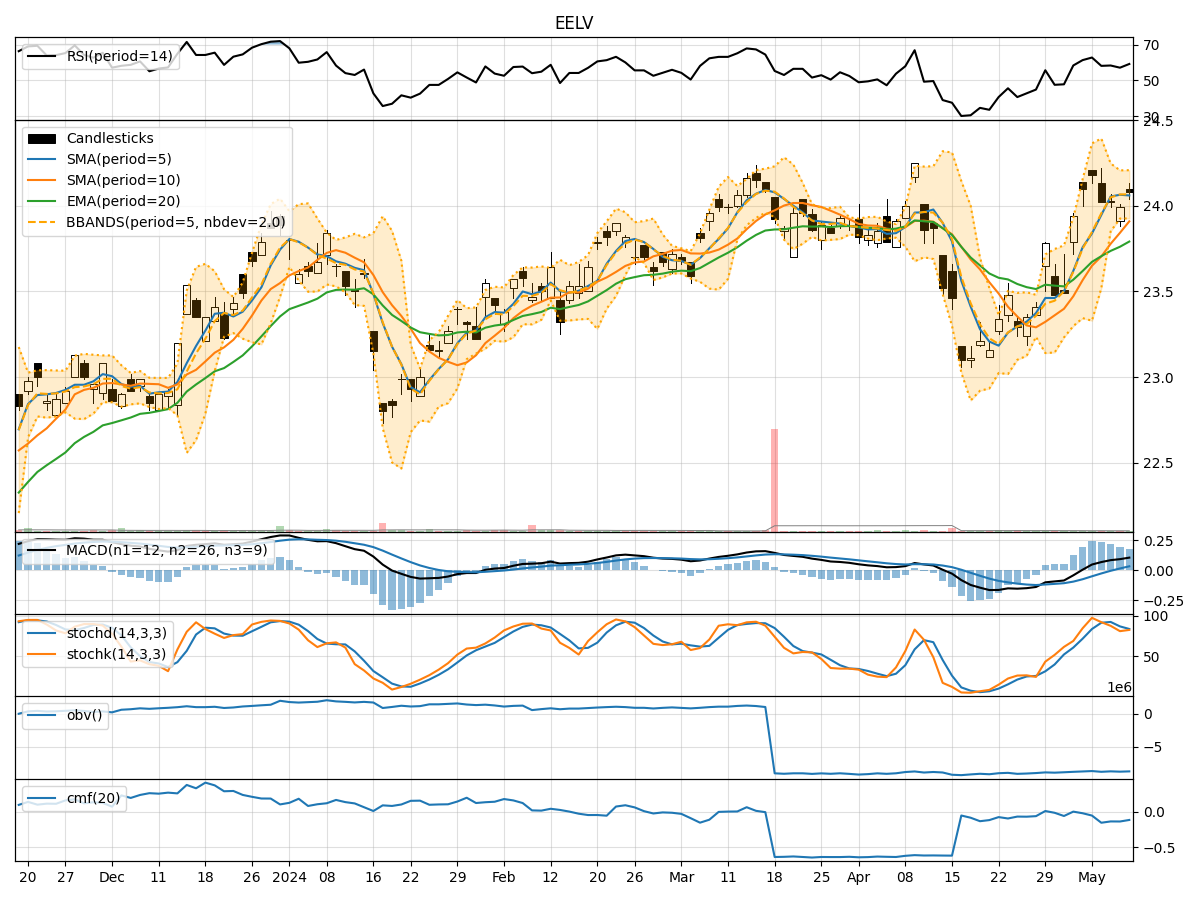
- Moving Averages (MA): The 5-day MA has been consistently above the closing prices, indicating an upward trend. Both the SMA(10) and EMA(20) have also shown an increasing trend, supporting a bullish view.
- MACD: The MACD line has been above the signal line for the past 5 days, with the MACD histogram showing an expanding positive momentum. This suggests a bullish sentiment in the short term.
Momentum Analysis:
- RSI: The RSI has been fluctuating around the 50 level, indicating neutral momentum in the stock. There is no clear overbought or oversold signal.
- Stochastic Oscillator: Both %K and %D lines of the Stochastic Oscillator have been moving in a sideways manner, suggesting a lack of strong momentum direction.
- Williams %R: The Williams %R is hovering around the oversold territory, indicating a potential buying opportunity.
Volatility Analysis:
- Bollinger Bands: The stock price has been trading within the Bollinger Bands, with the bands narrowing over the last few days. This suggests a decrease in volatility and a possible consolidation phase.
- Bollinger %B: The %B indicator is around 0.5, indicating the stock is trading at the middle of the bands, further supporting the consolidation view.
Volume Analysis:
- On-Balance Volume (OBV): The OBV has been fluctuating but has not shown a clear trend, indicating mixed buying and selling pressure.
- Chaikin Money Flow (CMF): The CMF has been negative, suggesting outflow of money from the stock over the past 20 days.
Conclusion:
Based on the analysis of the technical indicators, the stock of EELV is likely to experience sideways movement in the coming days. The trend indicators point towards a bullish bias, supported by the moving averages and MACD. However, the momentum indicators suggest a lack of strong momentum in either direction. The volatility indicators indicate a consolidation phase with decreasing volatility. The volume indicators show mixed signals with no clear trend in buying or selling pressure.
Therefore, the overall outlook for EELV in the next few days is neutral with a slight bullish bias. Traders may consider waiting for more definitive signals before taking significant positions.