Technical Analysis of EEMA 2024-05-10
Overview:
In analyzing the technical indicators for the EEMA stock over the last 5 days, we will delve into the trends, momentum, volatility, and volume indicators to provide a comprehensive outlook on the possible stock price movement in the coming days. By examining these key aspects, we aim to offer valuable insights and recommendations for potential investors.
Trend Analysis:
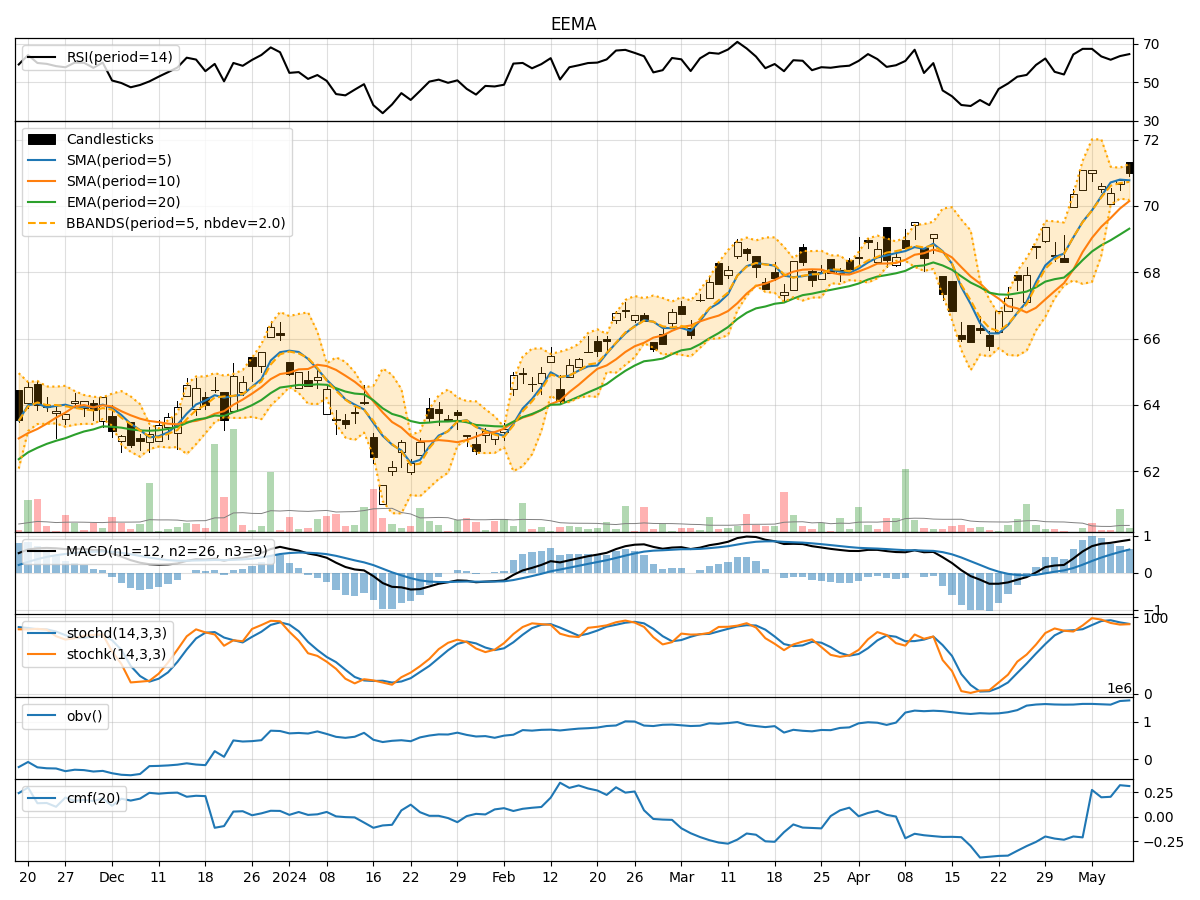
- Moving Averages (MA): The 5-day Moving Average (MA) has been consistently above the Simple Moving Average (SMA) and Exponential Moving Average (EMA), indicating a bullish trend.
- MACD: The MACD line has been above the signal line, with both lines showing an upward trend, suggesting bullish momentum.
- MACD Histogram: The MACD Histogram has been increasing, indicating strengthening bullish momentum.
Momentum Analysis:
- RSI: The Relative Strength Index (RSI) has been in the overbought territory, suggesting a potential reversal or consolidation.
- Stochastic Oscillator: Both %K and %D have been relatively high, indicating a strong bullish momentum.
- Williams %R: The Williams %R has been in the oversold region, signaling a potential reversal.
Volatility Analysis:
- Bollinger Bands (BB): The stock price has been trading within the Bollinger Bands, with the bands narrowing, indicating decreasing volatility.
- Bollinger %B: The %B indicator has been hovering around 0.5, suggesting a balanced market sentiment.
Volume Analysis:
- On-Balance Volume (OBV): The OBV has shown an overall increase, indicating accumulation by investors.
- Chaikin Money Flow (CMF): The CMF has been positive, reflecting buying pressure in the market.
Key Observations:
- The trend indicators suggest a strong bullish sentiment, supported by the moving averages and MACD.
- Momentum indicators show conflicting signals with RSI in the overbought zone and Williams %R in the oversold region.
- Volatility has been decreasing, indicating a potential period of consolidation.
- Volume indicators point towards accumulation and positive buying pressure.
Conclusion:
Based on the analysis of the technical indicators, the EEMA stock is likely to experience further upward movement in the coming days. The bullish trend supported by moving averages and MACD suggests continued positive momentum. However, caution is advised due to conflicting signals from the momentum indicators, indicating a possible period of consolidation or a minor pullback before resuming the uptrend. Overall, the outlook remains bullish with a potential for sideways consolidation in the short term. Investors should closely monitor key support and resistance levels for timely decision-making.