Technical Analysis of EEMD 2024-05-10
Overview:
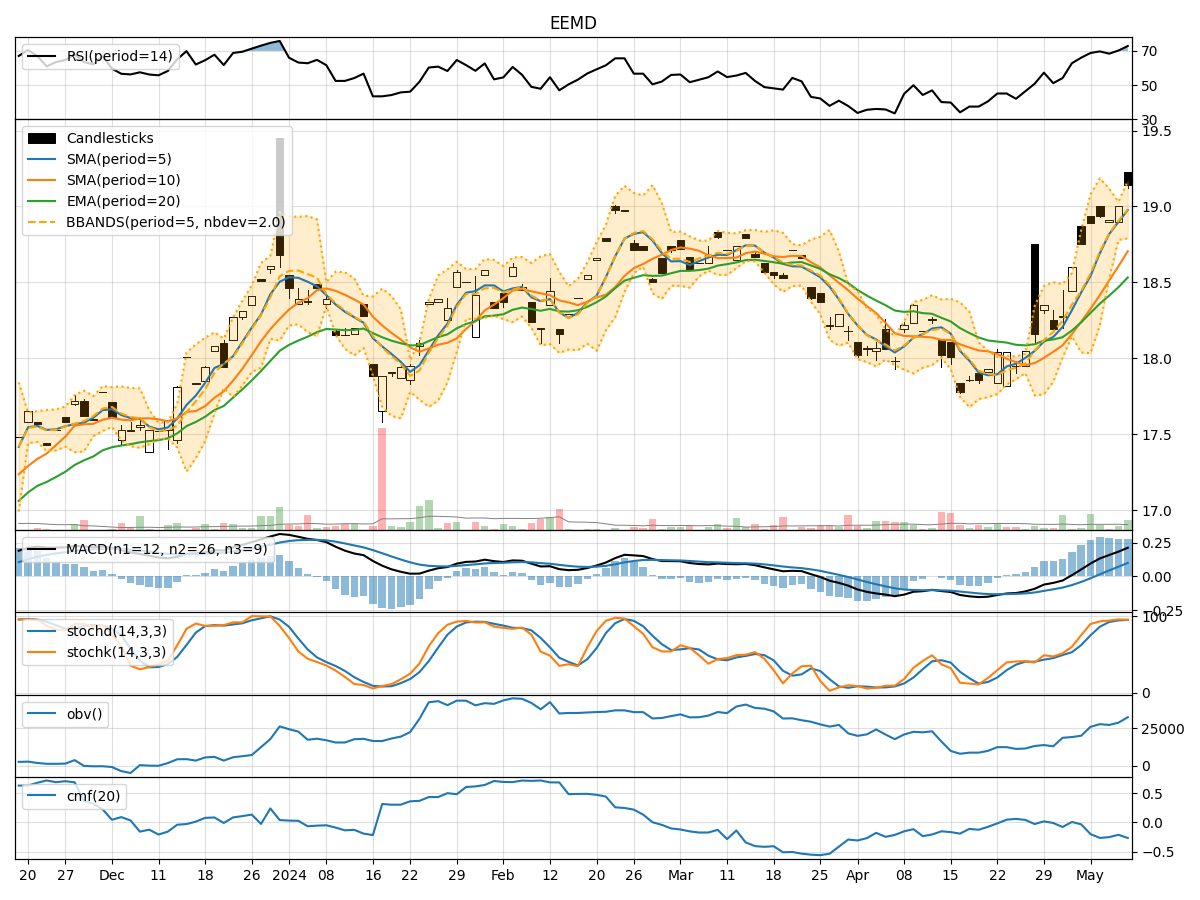
In the last 5 trading days, the stock price of EEMD has shown a gradual increase, with the closing price rising from 18.89 to 19.14. Various technical indicators across trend, momentum, volatility, and volume have been analyzed to provide insights into the possible future stock price movement.
Trend Indicators:
- Moving averages (MA) show a positive trend, with the 5-day MA consistently above the 10-day simple moving average (SMA).
- Exponential moving average (EMA) has been steadily increasing, indicating a bullish trend.
- MACD and MACD Histogram are both positive, suggesting upward momentum.
Key Observation: The trend indicators point towards a bullish outlook for EEMD.
Momentum Indicators:
- Relative Strength Index (RSI) is in the overbought territory, indicating a strong buying momentum.
- Stochastic Oscillator shows values above 80, signaling potential overbought conditions.
- Williams %R (WILLR) is also in the oversold region.
Key Observation: Momentum indicators suggest a potential pullback or consolidation in the near term.
Volatility Indicators:
- Bollinger Bands (BB) are narrowing, indicating decreasing volatility.
- The lower band of the BB is moving closer to the stock price, suggesting a potential price breakout.
Key Observation: Volatility indicators hint at a potential price breakout in the near future.
Volume Indicators:
- On-Balance Volume (OBV) has been negative, indicating distribution rather than accumulation.
- Chaikin Money Flow (CMF) is also negative, reflecting selling pressure.
Key Observation: Volume indicators suggest a bearish sentiment in the market.
Conclusion:
Based on the analysis of technical indicators, the next few days for EEMD stock price movement could see a potential pullback or consolidation due to overbought conditions indicated by momentum indicators. However, the bullish trend suggested by trend indicators and the possibility of a price breakout highlighted by volatility indicators may lead to a resumption of the upward trend in the medium term.
Considering the overall picture, it is advisable to exercise caution and closely monitor the price action, especially for signs of a reversal or continuation of the bullish trend. Traders and investors should be prepared for increased volatility and adjust their strategies accordingly to capitalize on potential opportunities while managing risks effectively.