Technical Analysis of EEMO 2024-05-10
Overview:
In analyzing the technical indicators for EEMO over the last 5 days, we will delve into the trend, momentum, volatility, and volume indicators to provide a comprehensive outlook on the possible stock price movement in the coming days. By examining these key aspects, we aim to offer valuable insights and predictions to guide your investment decisions.
Trend Analysis:
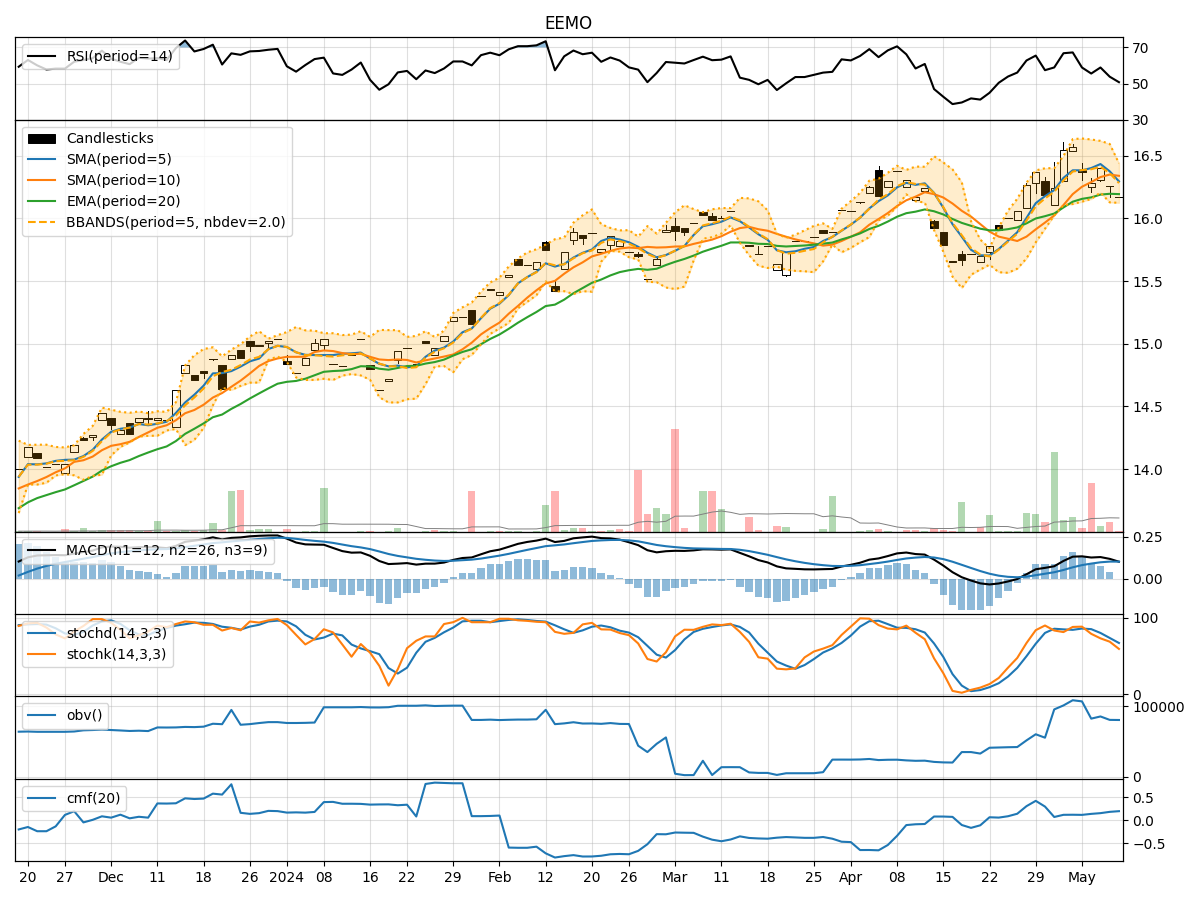
- Moving Averages (MA): The 5-day MA has been fluctuating around the closing prices, indicating short-term price trends. The SMA(10) and EMA(20) have shown a slight upward trend, suggesting potential bullish momentum.
- MACD: The MACD line has been positive, indicating a bullish trend. The MACD Histogram has been increasing, reflecting strengthening bullish momentum.
Momentum Analysis:
- RSI: The RSI has been fluctuating around the mid-range, indicating indecision in the market. It has not reached overbought or oversold levels, suggesting a neutral stance.
- Stochastic Oscillator: Both %K and %D have been declining, indicating a potential bearish momentum. The values are not in oversold territory yet, but caution is warranted.
Volatility Analysis:
- Bollinger Bands (BB): The stock price has been trading within the bands, suggesting a period of consolidation. The bands are not expanding significantly, indicating stable volatility.
- Bollinger %B: The %B indicator has been hovering around the middle range, signifying a balanced market sentiment.
Volume Analysis:
- On-Balance Volume (OBV): The OBV has shown mixed signals with slight declines, indicating some distribution of shares. This could suggest weakening buying pressure.
- Chaikin Money Flow (CMF): The CMF has been gradually increasing, indicating a potential inflow of money into the stock. This could support a bullish bias.
Conclusion:
Based on the analysis of the technical indicators, the stock price of EEMO is likely to experience sideways consolidation in the coming days. The trend indicators suggest a slight bullish bias, supported by the positive MACD and moving averages. However, the momentum indicators show a potential bearish divergence, especially with the declining stochastic values.
Considering the stable volatility and mixed volume signals, it is crucial to exercise caution in trading EEMO. Investors should closely monitor key support and resistance levels to navigate potential price fluctuations. Overall, a neutral to slightly bearish outlook is recommended until clearer signals emerge in the technical indicators.