Technical Analysis of EEMV 2024-05-10
Overview:
In analyzing the technical indicators for EEMV over the last 5 days, we will delve into the trend, momentum, volatility, and volume indicators to provide a comprehensive outlook on the possible stock price movement in the coming days. By examining these key aspects, we aim to offer valuable insights and predictions to guide your investment decisions.
Trend Analysis:
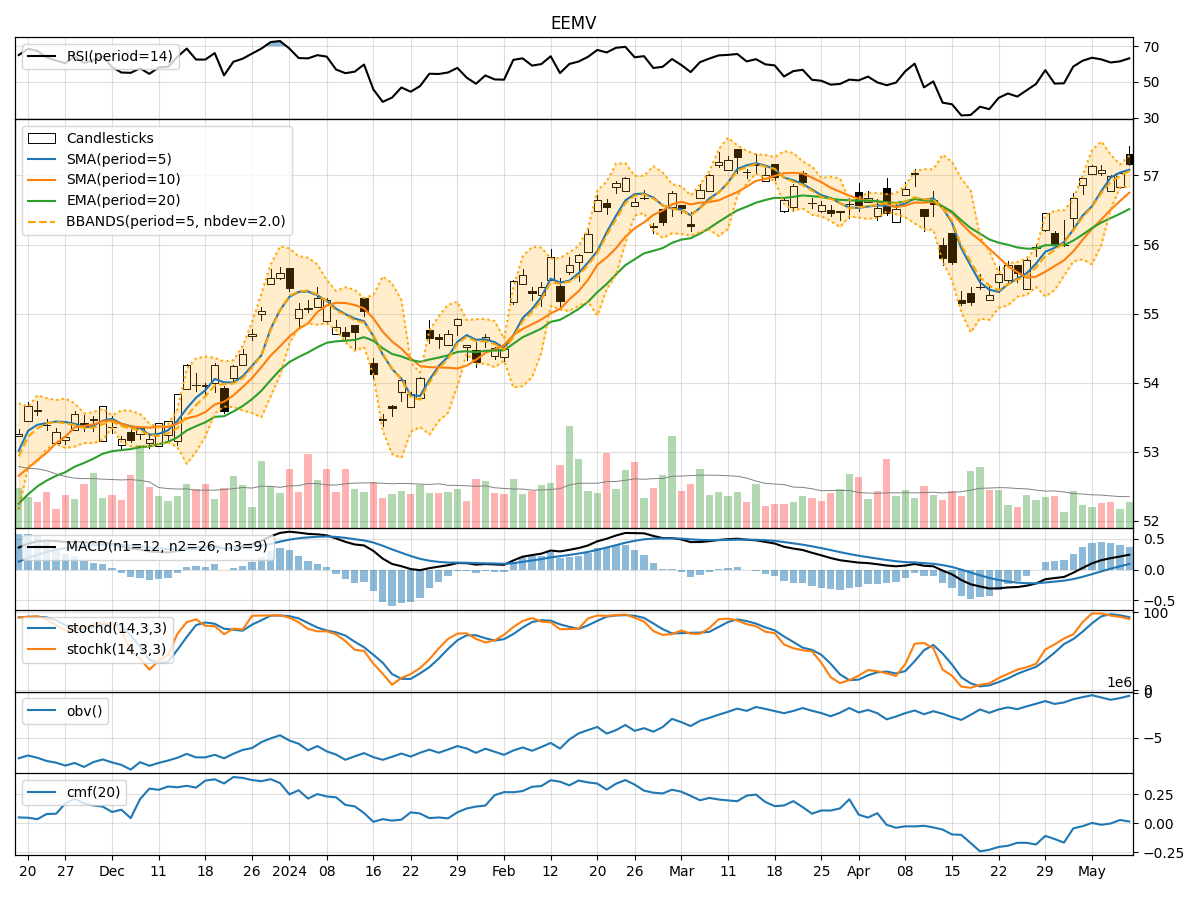
- Moving Averages (MA): The 5-day MA has been consistently above the 10-day SMA, indicating a short-term bullish trend.
- Exponential Moving Average (EMA): The EMA has been trending upwards, suggesting a positive momentum in the stock price.
- Moving Average Convergence Divergence (MACD): The MACD and signal line have been in an uptrend, with the MACD line staying above the signal line, signaling a bullish momentum.
Key Observation: The trend indicators point towards an upward trajectory in the stock price.
Momentum Analysis:
- Relative Strength Index (RSI): The RSI has been fluctuating around the overbought territory, indicating strong buying pressure.
- Stochastic Oscillator: Both %K and %D have been gradually decreasing but remain in the overbought zone, suggesting a potential reversal.
- Williams %R (Willams %R): The Williams %R is in the oversold region, indicating a possible buying opportunity.
Key Observation: The momentum indicators suggest a mixed sentiment with a slight bearish bias.
Volatility Analysis:
- Bollinger Bands (BB): The stock price has been trading within the upper Bollinger Band, indicating an overbought condition.
- Bollinger Band Width (BBW): The BBW has been narrowing, suggesting a potential decrease in volatility.
- Bollinger Band %B (BBP): The %B is above 0.8, indicating an overbought condition.
Key Observation: The volatility indicators signal a potential decrease in volatility and a short-term pullback in the stock price.
Volume Analysis:
- On-Balance Volume (OBV): The OBV has been fluctuating, indicating indecision among investors.
- Chaikin Money Flow (CMF): The CMF has been mostly positive, suggesting buying pressure in the stock.
Key Observation: The volume indicators reflect mixed sentiment with a slight bullish bias.
Conclusion:
Based on the analysis of the technical indicators, the overall outlook for EEMV in the next few days is as follows: - Trend: Upward - Momentum: Mixed with a Bearish Bias - Volatility: Potential Decrease - Volume: Mixed with a Slight Bullish Bias
Final Verdict:
Considering the comprehensive analysis of the technical indicators, the next few days for EEMV are likely to see a consolidation phase with a slight bearish bias due to mixed momentum signals and a potential decrease in volatility. Investors should closely monitor key support and resistance levels for potential entry or exit points.