Technical Analysis of EEMX 2024-05-10
Overview:
In analyzing the technical indicators for EEMX over the last 5 days, we will delve into the trend, momentum, volatility, and volume indicators to provide a comprehensive outlook on the possible stock price movement in the coming days. By examining these key aspects, we aim to offer valuable insights and recommendations for informed decision-making.
Trend Indicators:
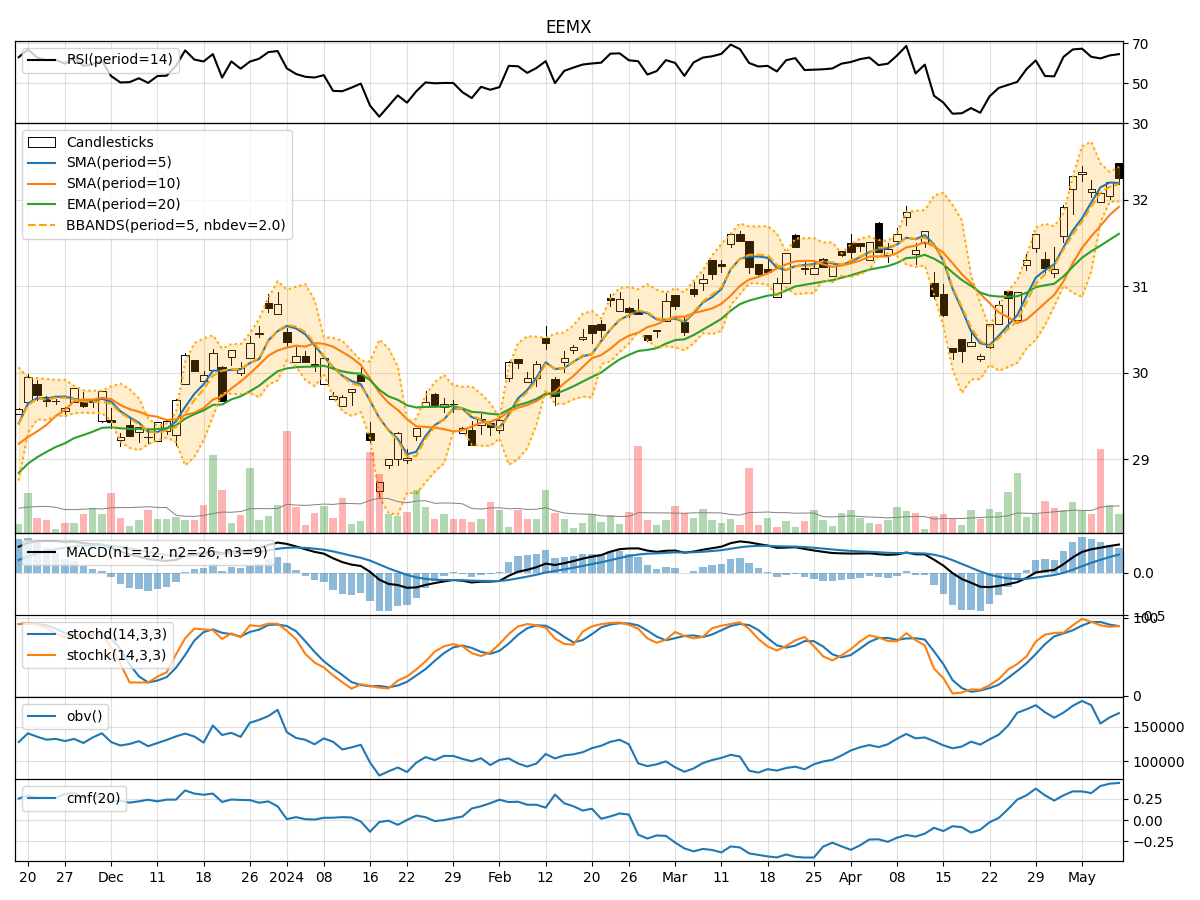
- Moving Averages (MA): The 5-day MA has been consistently above the closing prices, indicating a bullish trend.
- MACD: The MACD line has been above the signal line, suggesting a positive momentum in the stock price.
- RSI: The RSI values have been above 50, reflecting bullish momentum in the stock.
Momentum Indicators:
- Stochastic Oscillator: The Stochastic Oscillator values have been fluctuating but generally staying in the overbought territory, signaling potential for a pullback.
- Williams %R: The Williams %R values have been negative, indicating an oversold condition.
Volatility Indicators:
- Bollinger Bands (BB): The stock price has been trading within the Bollinger Bands, with the bands narrowing, suggesting a potential breakout.
- Average True Range (ATR): The ATR values have been relatively stable, indicating consistent price movement.
Volume Indicators:
- On-Balance Volume (OBV): The OBV values have been fluctuating, indicating mixed sentiment among investors.
- Chaikin Money Flow (CMF): The CMF values have been positive, suggesting buying pressure in the stock.
Key Observations and Opinions:
- Trend: The stock is in an upward trend based on moving averages and MACD.
- Momentum: The momentum indicators show a mixed signal with potential for a pullback due to overbought conditions.
- Volatility: The narrowing Bollinger Bands indicate a potential breakout in the stock price.
- Volume: The volume indicators suggest mixed sentiment among investors.
Conclusion:
Based on the analysis of the technical indicators, the next few days' possible stock price movement for EEMX is likely to be sideways with a bullish bias. Investors should closely monitor the Stochastic Oscillator for potential pullback signals and the Bollinger Bands for a breakout confirmation. It is advisable to exercise caution and consider implementing risk management strategies in trading decisions.