Technical Analysis of EES 2024-05-10
Overview:
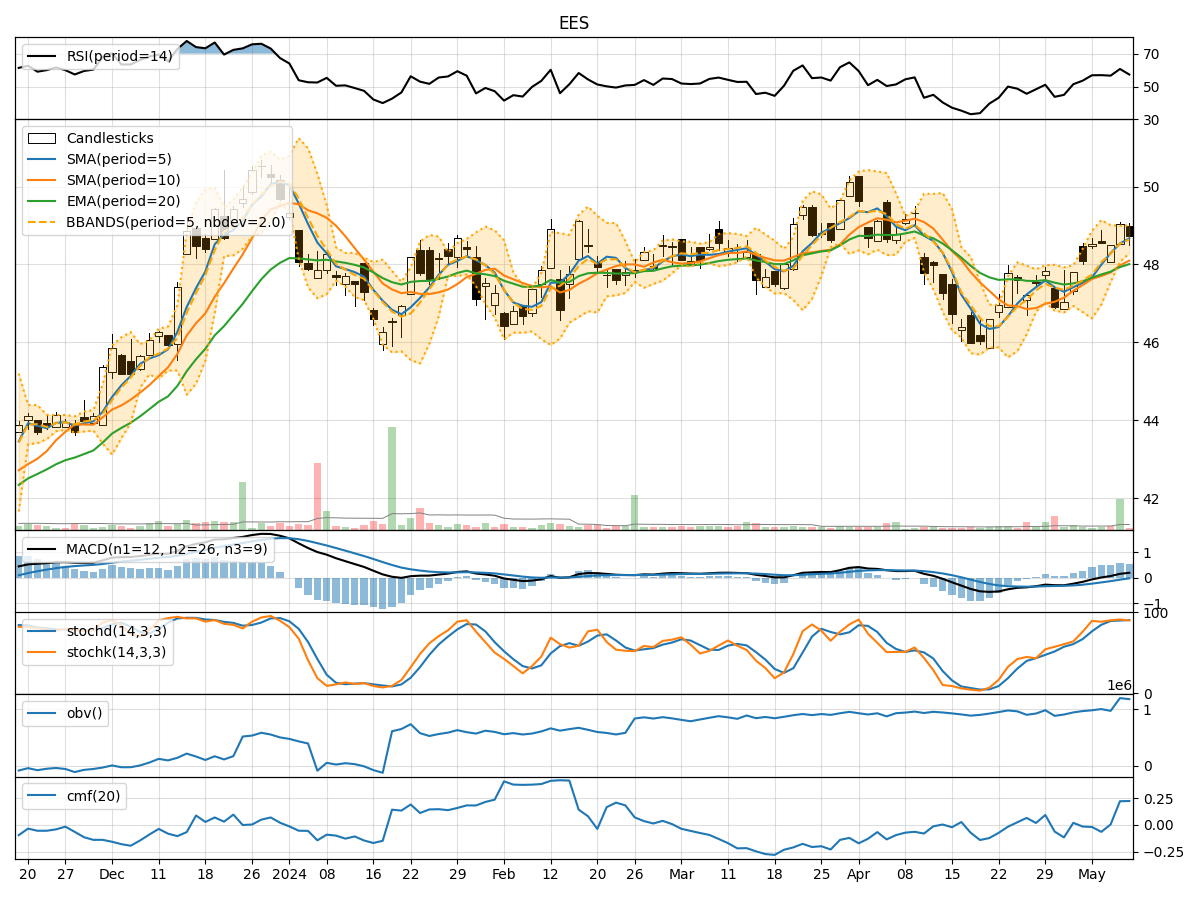
In analyzing the technical indicators for EES stock over the last 5 days, we will delve into the trend, momentum, volatility, and volume indicators to provide a comprehensive outlook on the possible stock price movement in the coming days.
Trend Analysis:
- Moving Averages (MA): The 5-day Moving Average (MA) has been consistently above the 10-day Simple Moving Average (SMA), indicating a short-term bullish trend.
- Exponential Moving Average (EMA): The EMA has been trending upwards, reflecting positive price momentum.
- MACD: The MACD line has been above the signal line, suggesting bullish momentum.
Key Observation: The trend indicators point towards a bullish sentiment in the short term.
Momentum Analysis:
- RSI: The Relative Strength Index (RSI) has been fluctuating around the overbought territory, indicating strong buying pressure.
- Stochastic Oscillator: Both %K and %D have been in the overbought zone, signaling potential price strength.
- Williams %R: The Williams %R has been consistently in the oversold region, suggesting a potential reversal.
Key Observation: Momentum indicators suggest a mixed sentiment with overbought conditions but also potential for a reversal.
Volatility Analysis:
- Bollinger Bands (BB): The price has been trading within the Bollinger Bands, indicating normal volatility.
- Bollinger Band Width (BBW): The BBW has been relatively stable, suggesting consistent price movement.
- Bollinger Band %B (BBP): The %B has been fluctuating within the bands, indicating price consolidation.
Key Observation: Volatility indicators suggest a period of price consolidation and stability.
Volume Analysis:
- On-Balance Volume (OBV): The OBV has shown an overall increase, indicating accumulation by investors.
- Chaikin Money Flow (CMF): The CMF has been positive, reflecting buying pressure in the market.
Key Observation: Volume indicators support the bullish sentiment with increasing accumulation and buying pressure.
Conclusion:
Based on the analysis of trend, momentum, volatility, and volume indicators, the overall outlook for EES stock in the next few days is bullish. The trend indicators show a positive momentum, supported by strong buying pressure as indicated by the momentum and volume indicators. Although there are signs of overbought conditions, the overall market sentiment remains positive.
Key Conclusion: The stock is likely to experience upward movement in the coming days, with potential for further price appreciation. Investors may consider maintaining or initiating long positions based on the current technical analysis.