Technical Analysis of EET 2024-05-10
Overview:
In analyzing the technical indicators for EET stock over the last 5 days, we will delve into the trend, momentum, volatility, and volume indicators to provide a comprehensive outlook on the possible future stock price movement. By examining these key indicators, we aim to offer valuable insights and recommendations for potential investors.
Trend Indicators:
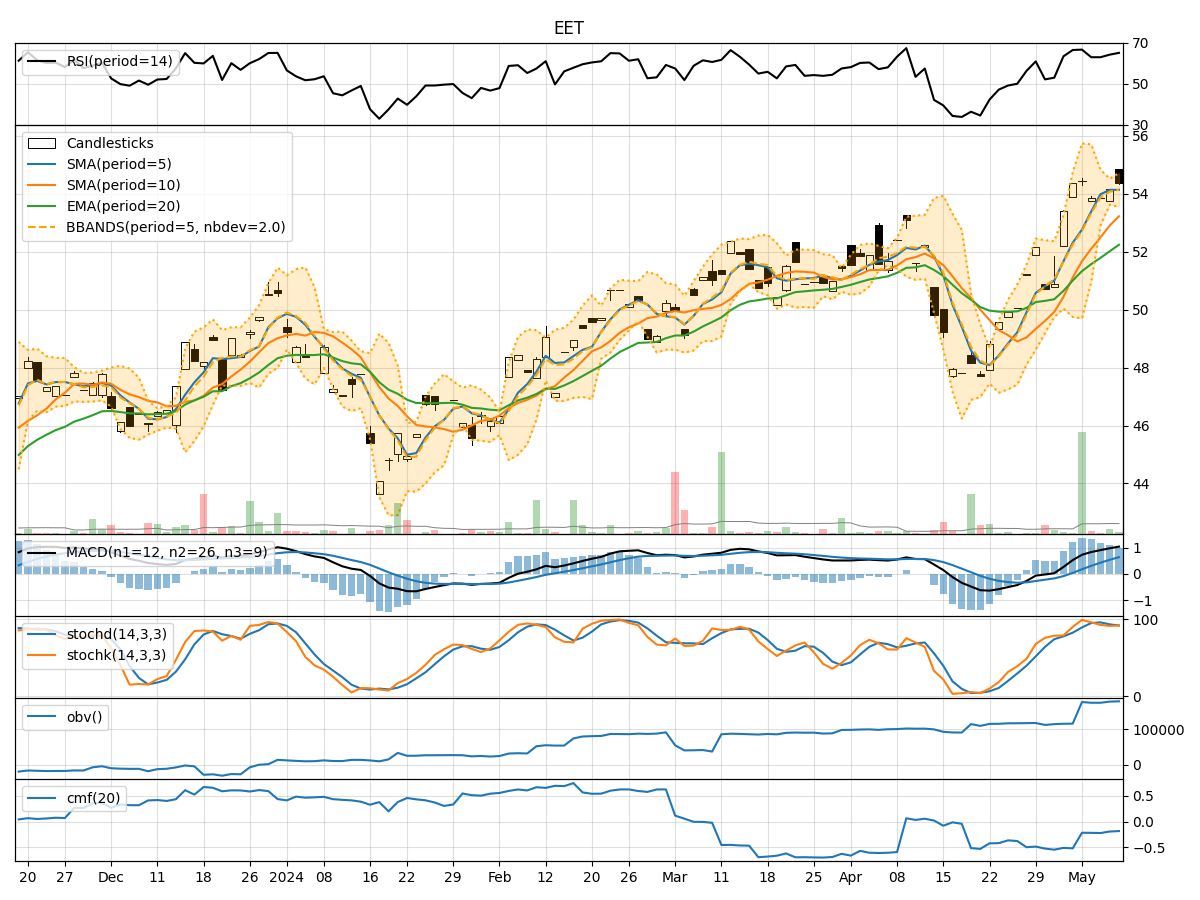
- Moving Averages (MA): The 5-day moving average has been consistently above the longer-term moving averages (SMA and EMA), indicating a bullish trend.
- Moving Average Convergence Divergence (MACD): The MACD line has been consistently above the signal line, suggesting a bullish momentum.
- Conclusion: The trend indicators point towards an upward trend in the stock price.
Momentum Indicators:
- Relative Strength Index (RSI): The RSI has been in the overbought territory, indicating a strong buying momentum.
- Stochastic Oscillator: Both %K and %D have been relatively high, suggesting bullish momentum.
- Conclusion: The momentum indicators signal a bullish sentiment in the market.
Volatility Indicators:
- Bollinger Bands (BB): The stock price has been trading within the bands, indicating moderate volatility.
- Conclusion: Volatility is relatively stable, suggesting a sideways movement in the stock price.
Volume Indicators:
- On-Balance Volume (OBV): The OBV has shown a slight increase, indicating accumulation of the stock.
- Chaikin Money Flow (CMF): The CMF has been negative, suggesting a slight selling pressure.
- Conclusion: Volume indicators imply a neutral to slightly bearish sentiment.
Conclusion:
Based on the analysis of the technical indicators, the overall outlook for EET stock in the next few days is bullish. The trend and momentum indicators strongly support a continued upward movement in the stock price. However, the volatility indicators suggest a potential sideways movement, while the volume indicators indicate a neutral to slightly bearish sentiment.
Recommendation:
Considering the bullish trend and momentum, investors may consider buying EET stock for potential short to medium-term gains. It is essential to monitor the price action closely, especially in relation to the Bollinger Bands for potential breakout opportunities. Additionally, keeping an eye on volume trends can provide insights into market sentiment.
Disclaimer:
Please note that while technical analysis provides valuable insights, it is essential to consider other fundamental factors and market dynamics before making investment decisions. It is advisable to consult with a financial advisor to tailor strategies based on individual risk tolerance and investment goals.