Technical Analysis of EFAD 2024-05-10
Overview:
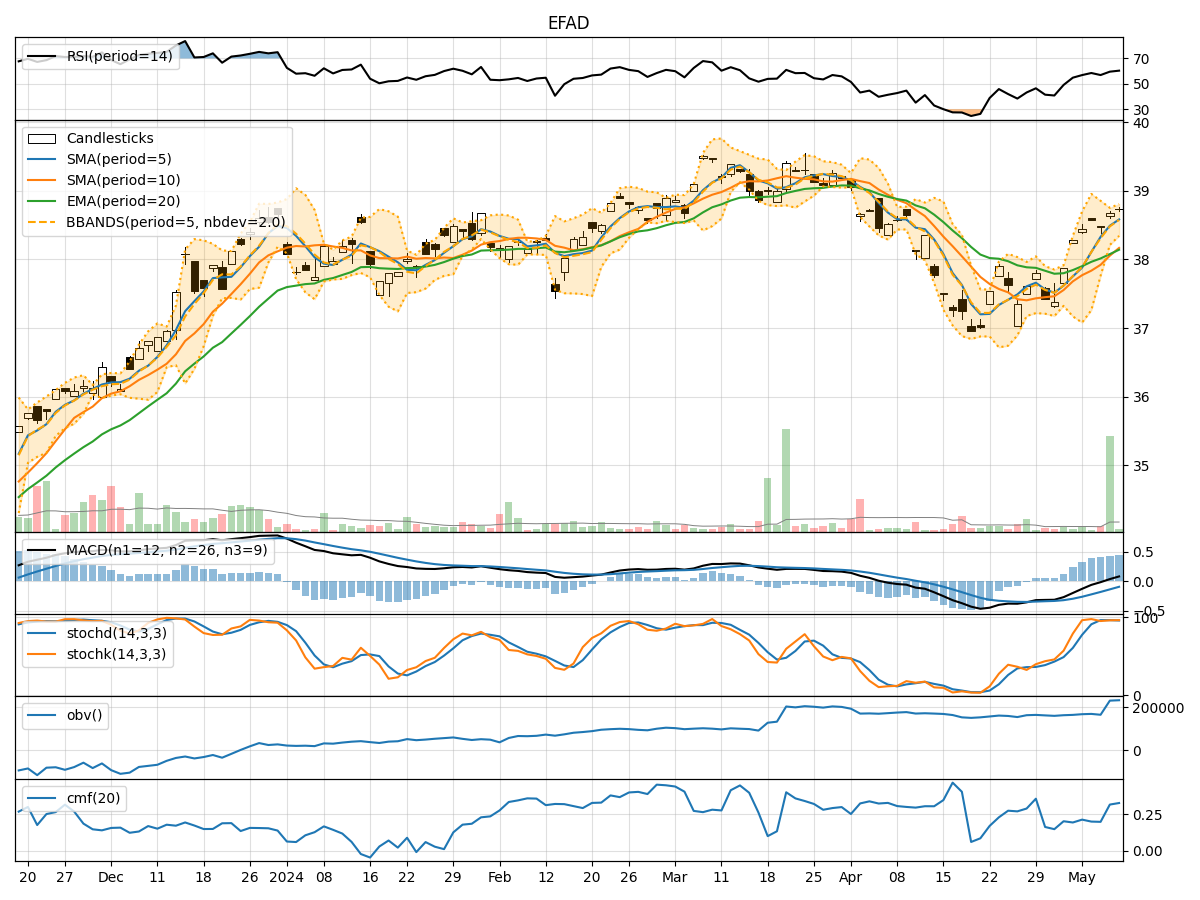
In analyzing the technical indicators for EFAD stock over the last 5 days, we will delve into the trends, momentum, volatility, and volume aspects to provide a comprehensive outlook on the possible stock price movement in the coming days. By examining key indicators such as moving averages, MACD, RSI, Bollinger Bands, and OBV, we aim to offer valuable insights and predictions for potential price action.
Trend Analysis:
- Moving Averages (MA): The 5-day moving average has been consistently above the 10-day simple moving average, indicating a short-term bullish trend.
- MACD: The MACD line has been consistently above the signal line, suggesting bullish momentum in the stock price.
Key Observation: The trend indicators point towards a bullish sentiment in the stock price.
Momentum Analysis:
- RSI (Relative Strength Index): RSI values have been trending upwards and are currently in the overbought territory, indicating strong buying momentum.
- Stochastic Oscillator: Both %K and %D values are high, suggesting that the stock is in overbought territory.
Key Observation: Momentum indicators signal an overbought condition in the stock.
Volatility Analysis:
- Bollinger Bands: The stock price has been trading within the upper Bollinger Band, indicating increased volatility and potential overbought conditions.
Key Observation: Volatility indicators suggest a high volatility environment.
Volume Analysis:
- On-Balance Volume (OBV): The OBV has been increasing over the last few days, indicating strong buying pressure.
Key Observation: Volume indicators reflect positive accumulation in the stock.
Conclusion:
Based on the analysis of the technical indicators, the stock of EFAD is currently exhibiting a bullish trend with strong momentum and high volatility. The overbought conditions indicated by momentum indicators and Bollinger Bands suggest a potential correction or consolidation in the stock price in the near term. However, the positive volume accumulation signals continued buying interest in the stock.
Forecast:
Given the current technical outlook, it is likely that EFAD stock may experience a short-term correction or consolidation before potentially resuming its upward trend. Traders should exercise caution and consider taking profits or implementing risk management strategies in anticipation of a possible pullback. Long-term investors may view any dips as buying opportunities to capitalize on the overall bullish sentiment in the stock.
Disclaimer:
This analysis is based solely on technical indicators and historical data, and actual market movements may vary. It is essential to consider other fundamental factors and market dynamics before making investment decisions. Consult with a financial advisor for personalized guidance tailored to your investment goals and risk tolerance.