Technical Analysis of EFAS 2024-05-10
Overview:
In analyzing the technical indicators for the last 5 days of EFAS stock, we will delve into the trend, momentum, volatility, and volume indicators to provide a comprehensive outlook on the possible stock price movement in the coming days. By examining these key aspects, we aim to offer valuable insights and predictions to guide investment decisions.
Trend Indicators:
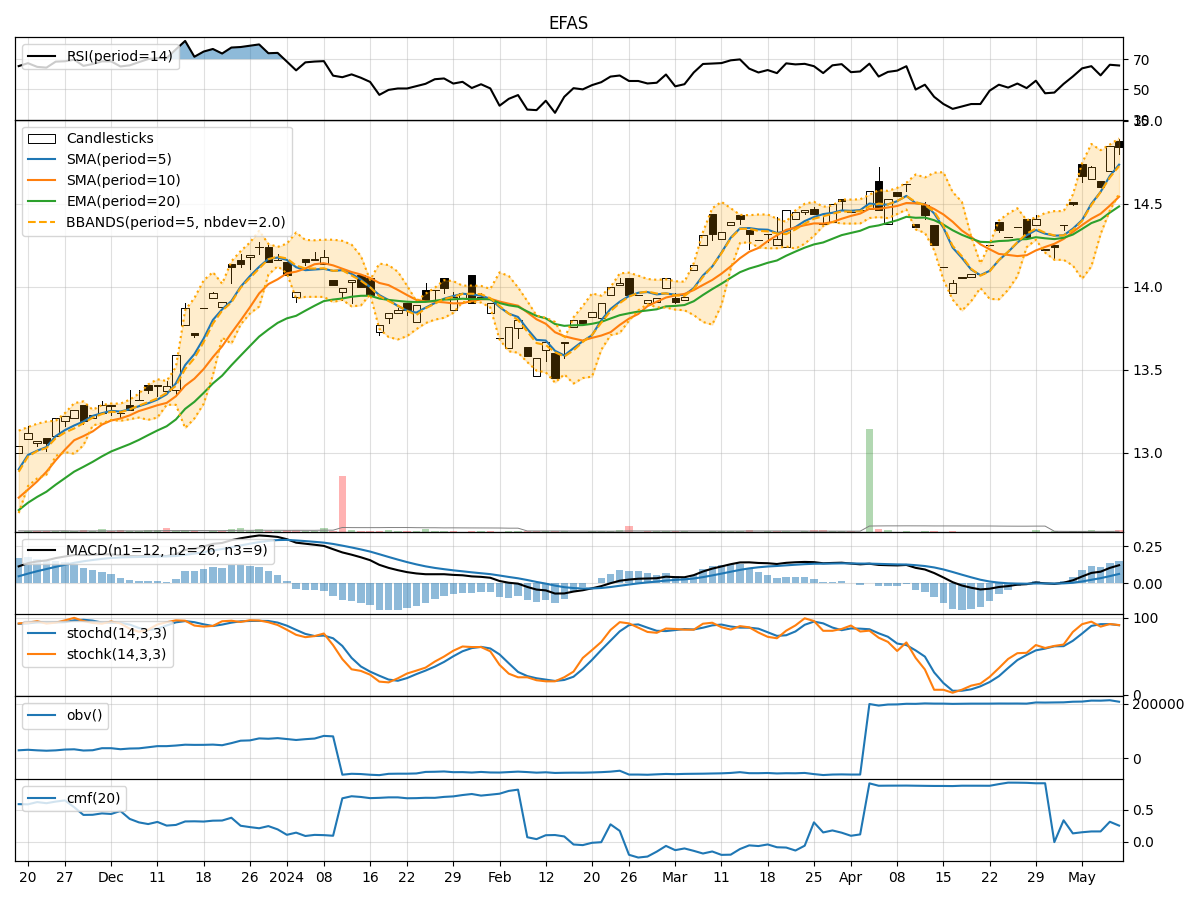
- Moving Averages (MA): The 5-day Moving Average (MA) has been consistently above the Simple Moving Average (SMA) and Exponential Moving Average (EMA), indicating a bullish trend.
- MACD: The Moving Average Convergence Divergence (MACD) has shown positive values, with the MACD line consistently above the Signal line, suggesting bullish momentum.
- Conclusion: The trend indicators point towards an upward trend in the stock price.
Momentum Indicators:
- RSI: The Relative Strength Index (RSI) has been hovering around 65, indicating a balanced momentum in the stock.
- Stochastic Oscillator: Both %K and %D have been fluctuating around the overbought region, suggesting a potential reversal.
- Conclusion: The momentum indicators suggest a neutral stance with a slight inclination towards a bearish outlook.
Volatility Indicators:
- Bollinger Bands: The stock price has mostly remained within the Bollinger Bands, with the bands narrowing, indicating decreasing volatility.
- Conclusion: Volatility indicators signal a sideways movement with a decreasing trend in volatility.
Volume Indicators:
- On-Balance Volume (OBV): The OBV has shown a slight increase over the last 5 days, indicating a positive volume flow.
- Chaikin Money Flow (CMF): The CMF has been positive, reflecting buying pressure in the stock.
- Conclusion: Volume indicators suggest a bullish sentiment with increasing buying pressure.
Conclusion:
Based on the analysis of the technical indicators, the next few days' possible stock price movement for EFAS is likely to be upward in the short term. The trend indicators support a bullish outlook, while volume indicators indicate increasing buying pressure. However, momentum indicators show a neutral to slightly bearish stance, suggesting a potential pullback or consolidation in the near future. Volatility indicators point towards a sideways movement with decreasing volatility.
Recommendation:
Considering the overall analysis, investors may consider buying opportunities on dips or pullbacks in the stock price, keeping a close watch on momentum indicators for potential reversals. It is essential to monitor the price action closely and set appropriate stop-loss levels to manage risk effectively. Additionally, staying updated on market news and events that may impact the stock's performance is crucial for making informed investment decisions.